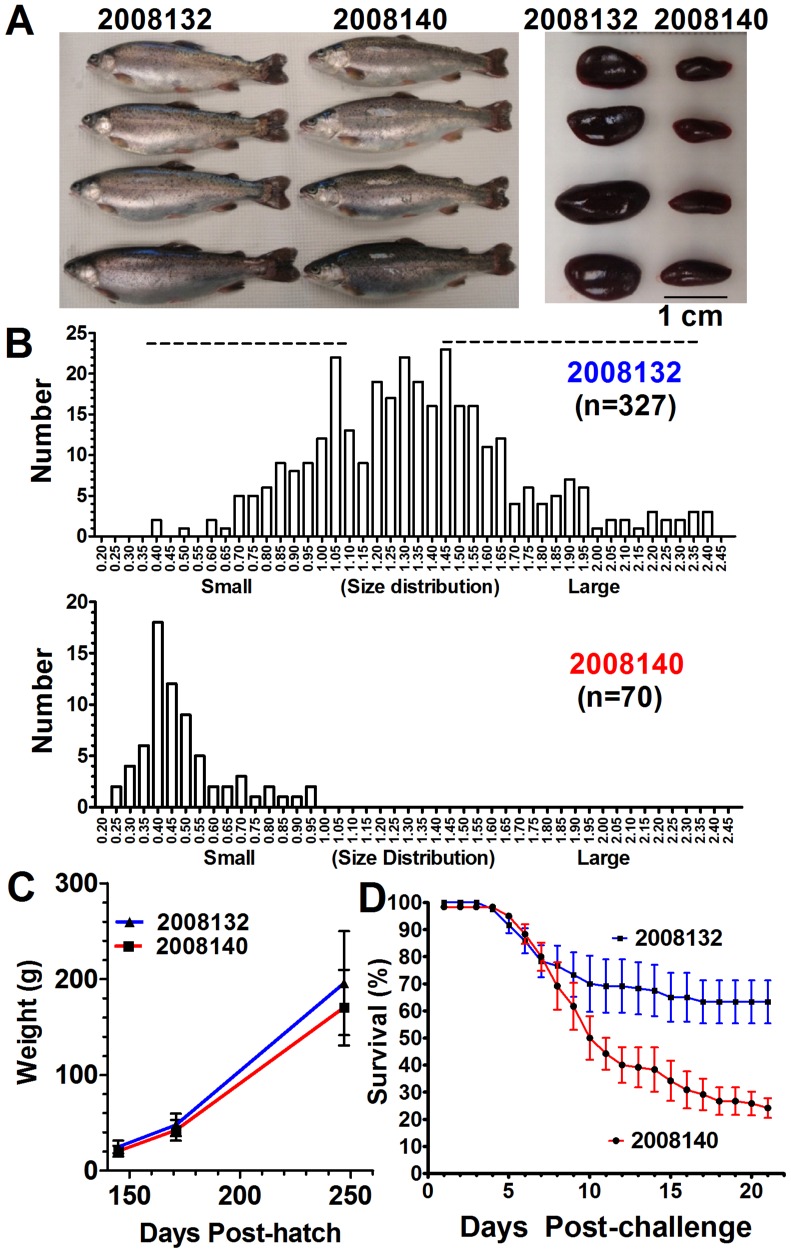
Figure 2. Rainbow trout families with divergent spleen indices: family with high average SI, 2008132, and low average SI, 2008140.
(A) Four randomly selected fish and respective spleens. (B) SI phenotype distribution of families 2008132 and 2008140. (C) Average body weights (not statistically different). (D) Survival following laboratory injection challenge with F. psychrophilum (P<0.001, results are an average from triplicate tanks, n = 40 fish per tank).

