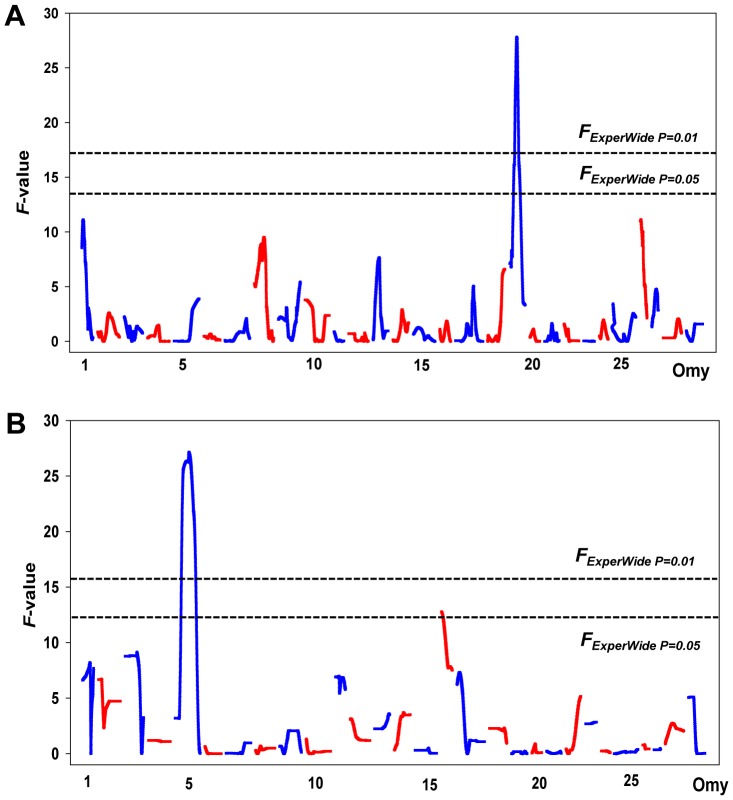
Figure 3. Quantitative trait loci for SI identified by half-sib (HS) family regression interval mapping in rainbow trout family 2008132.
(A) Plot of QTL for dam alleles showing all chromosomes. A major QTL was identified on Omy19. (B) Plots of quantitative trait loci for sire allels showing all chromosomes. Major QTL were identified on Omy5 and Omy16.

