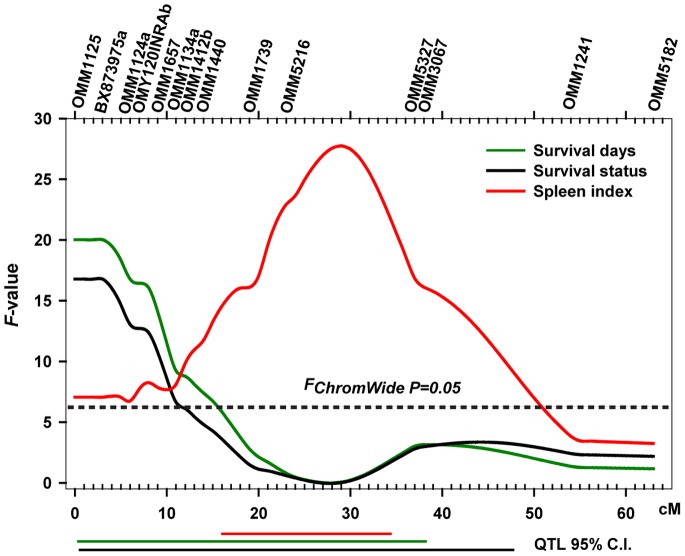
Figure 4. Plot of Omy19 showing QTL intervals for SI and BCWD resistance traits.
The location and designation of microsattalite markers used to identify the QTL are listed above the figure. The 95% confidence interval for each QTL is indicated below the graph by an individual line for each trait. Data for both SI and BCWD QTL fit a single QTL model with no evidence for a second QTL.

