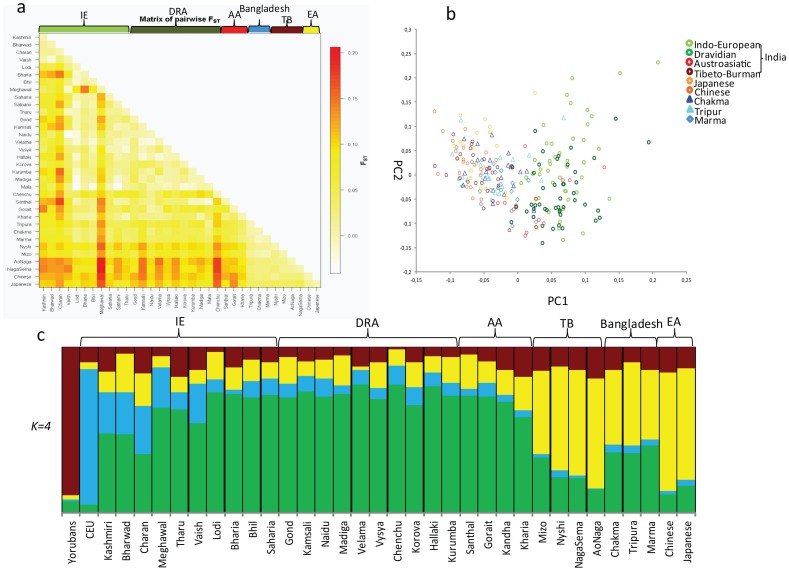
Figure 4. Autosomal Analysis.
a) Heat map of pairwise Fst of Bangladeshi tribal groups, in comparison with Indian and East Asian populations; b) PCA of Indian, East Asian and Bangladeshi groups. PC analysis was carried out using smartpca program (with default settings) of the EIGENSOFT package, PC1 represent 2.1%, while PC2 shows 1.7% of variations; c) Bar plot displays individual ancestry estimates for studied populations from a structure analysis by using STRUCTURE with K = 4.

