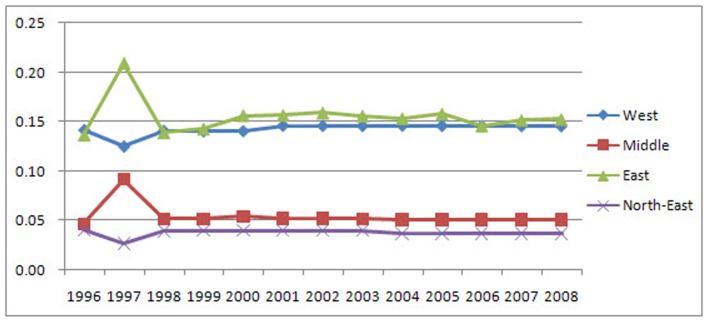
Figure 7. The district LGCSpatial values and trends of the farmland.
The distributions and trends of farmland are different than those of built-up and unused land. The LGCSpatial values of farmland are less than 0.2 in every district, indicating that farmland is absolutely equally distributed in all districts. In the Northeast, Middle and West Districts, farmland remained virtually stable, while in the East, it remained stable with slight fluctuations.

