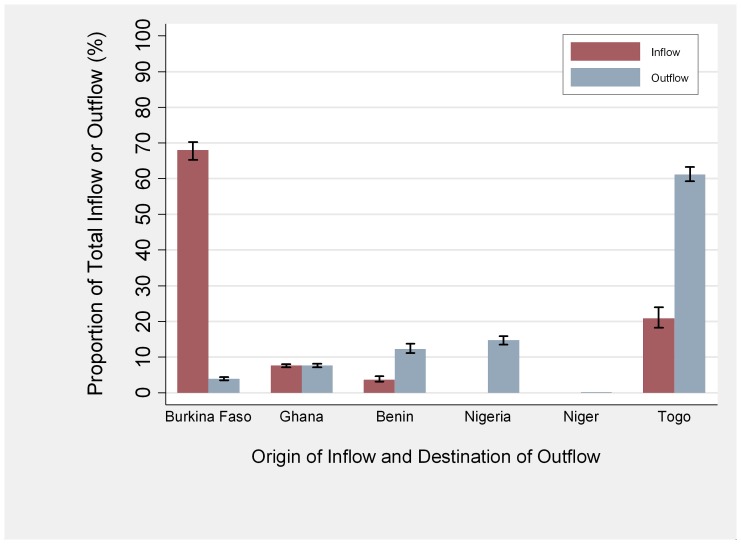
Figure 2. Simulated flows of cattle into and out of the market system of Savannah Region, Togo.
These simulated mean flows are shown for the six month dry season period, as a proportion of total flow into or out of the Savannah market system. The range of simulated values from minimum to maximum are shown as black bars.

