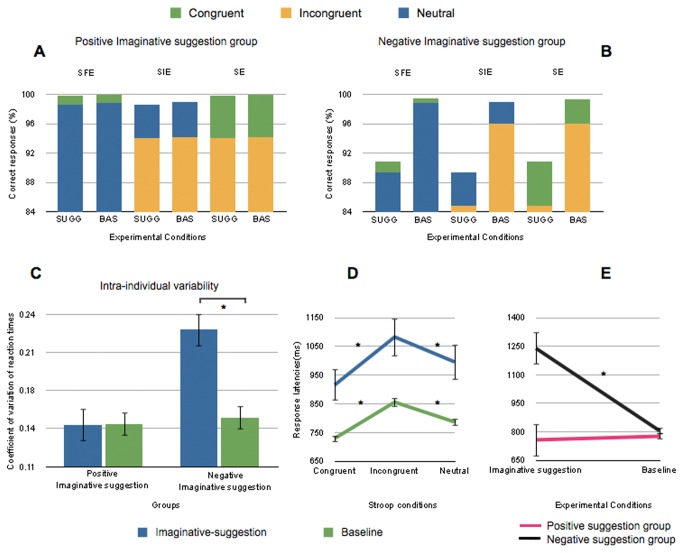
Figure 3. Results of Experiment 2 for accuracy, intra-individual variability and response latencies.
Accuracy (correct responses - CR) in the three Stroop congruency subtractions (SFE, SIE and SE), under Imaginative suggestion compared to baseline (A) in the positive group and (B) in the negative group. The upper parts of the stacked histogram graphs represent the Stroop congruency subtractions. (C) Intra-individual variability of reaction times in the positive and negative groups under Imaginative suggestion compared to baseline. (D) Response latencies (Reaction times – RT) in the three Stroop conditions (congruent, incongruent and neutral) under Imaginative suggestion compared to baseline, and (E) in the positive group and in the negative group under Imaginative suggestion compared to baseline.
Note: SFE = Stroop Facilitation effect; SIE = Stroop Interference effect; SE = global Stroop effect. SUGG = suggestion; BAS = Baseline. * indicates a significant difference (p < .05) between conditions. Error bars refer to standard errors.

