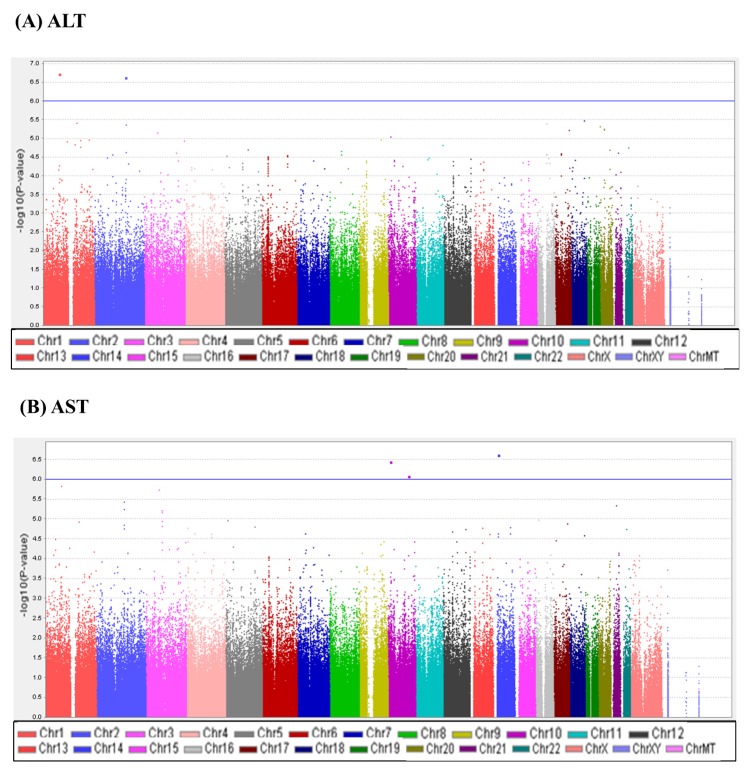
Fig. 1.
Manhattan plots of association results for alanine transaminase (ALT) and aspartate transaminase (AST) levels. Manhattan plots of the genome-wide analyses of association with ALT (A) and AST (B) are based on a total of 484 Korean children. Color scale of X-axis represents chromosomes, and negative logarithms of p-values are shown on the Y-axis.

