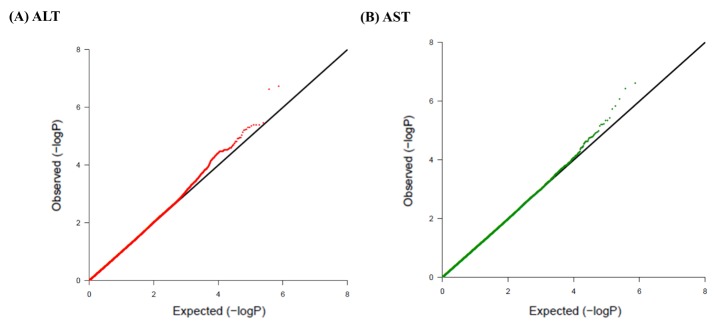
Fig. 2.

Quantile-quantile plots of association results for alanine transaminase (ALT) and aspartate transaminase (AST) levels in Korean children for 747,076 single nucleotide polymorphisms (SNPs). Quantile-quantile plots for ALT (A) and AST (B) AST are composed of X-axis and Y-axis indicate the negative log-scale of expected p-values of each SNP and the negative log-scale of the observed p-values, respectively. A straight line indicates the expected results under Hardy-Weinberg equilibrium.
