
Figure 1.
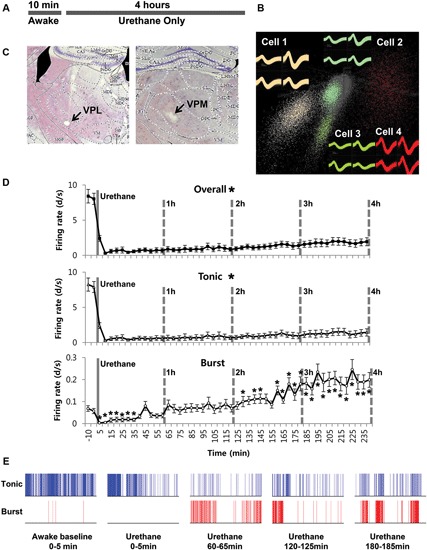
Thalamic neuronal activity changes by urethane anesthesia. (A) Timeline of the experimental procedure. (B) Spike sorting sample of multi-spike data from one tetrode into four single units using the SpikeSort3D program, which allows spike sorting based on the differences in waveform shape captured by the four individual electrodes composing a tetrode. (C) Histological sample of the recording locations. (D) Firing rate changes for overall, tonic and burst firing rate of thalamic neurons during awake and under urethane anesthesia analyzed in 5 min segments. Repeated measures ANOVA was used for statistical analysis over time. N = 32 neurons, 7 mice. All data points are mean ± SEM. Solid vertical gray-line indicates the point of urethane injection while the dotted vertical gray-line was placed to facilitate the visualization of firing pattern change over time after urethane anesthesia. Student’s t-test was used to compare before and after urethane. * Indicates significant difference at p < 0.05. When all points were significantly different from the awake baseline, * was placed next to the title. There was significant change over time for overall, tonic, and burst firing after urethane injection when repeated measures ANOVA analysis was used. (E) Spike train sample of tonic and burst firing from one neuron, in 5 min segments as indicated.