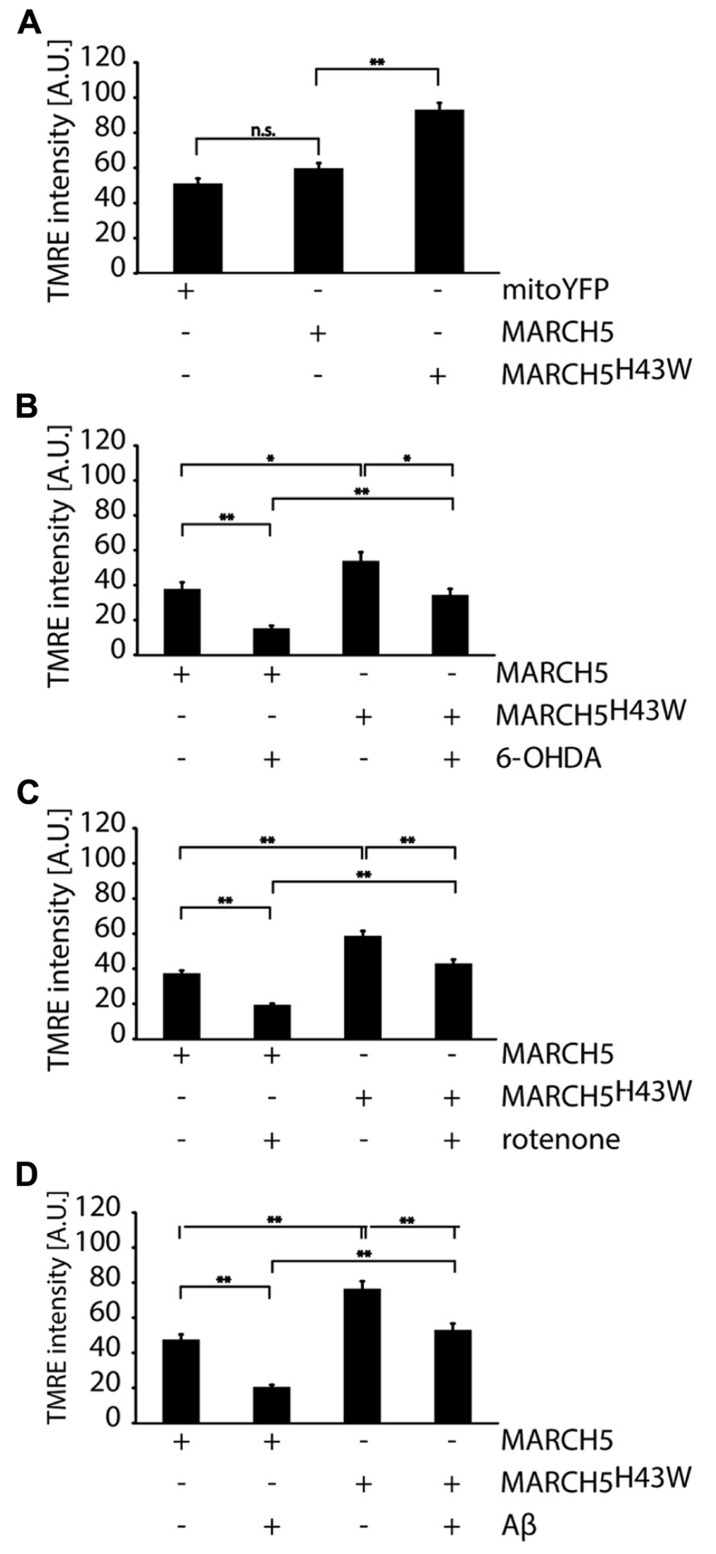
FIGURE 4.
Mitochondrial membrane potential under neurodegenerative stress conditions is increased following inactivation of MARCH5. (A) SH-SY5Y cells expressing mitoYFP, MARCH5-YFP, or MARCH5H43W-YFP were stained with the mitochondrial membrane potential sensitive dye TMRE, images were taken by confocal microscopy andTMRE fluorescence as measure for mitochondrial membrane potential was determined using image analysis. SH-SY5Y cells expressing MARCH5-YFP or MARCH5H43W-YFP were treated with 75 μM 6-hydroxydopamine for 6 h (B), 5 μM rotenone for 6 h (C), or 25 μMAβ peptide for 24 h (D) and mitochondrial membrane potential was measured as in (A). Shown is the average of three independent experiments with 10 cells each per condition. Statistical significance was analyzed using Student’s t-test with * p<0.05; n.s. p>0.05, not significant and ** marking p < 0.01. Error bars represent SEM.

