
Figure 5.
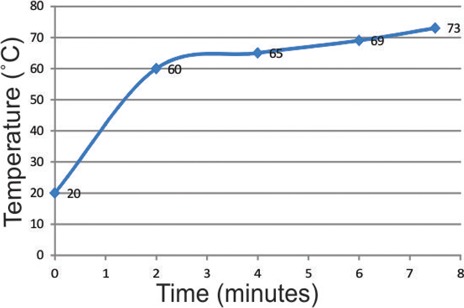
Line chart illustrating changes in buffer temperature over time, during the denaturation step.
Official websites use .gov
A
.gov website belongs to an official
government organization in the United States.
Secure .gov websites use HTTPS
A lock (
) or https:// means you've safely
connected to the .gov website. Share sensitive
information only on official, secure websites.
Line chart illustrating changes in buffer temperature over time, during the denaturation step.