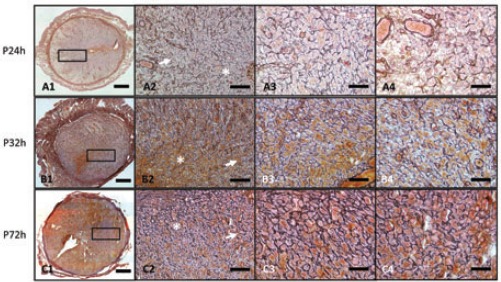
Figure 3.

A1-A3) Reticular fibers under progesterone maintenance instead of progesterone withdrawal at 24 h, 32 h, and 72 h shown at low magnification; scale bars: 400 μm. A2, B2, C2) The small boxes indicate the PZ, shown at a higher magnification; scale bars: 100 μm. A3, B3, C3) Stars represent the MDZ, and the indicated areas are also shown at a higher magnification; scale bars: 50 μm. A4, B4, C4) Arrowheads represent PZ, and the indicated areas are also shown at a higher magnification; scale bars: 50 μm. All the sections are representative of the results for at least 3 individuals at the same time point.
