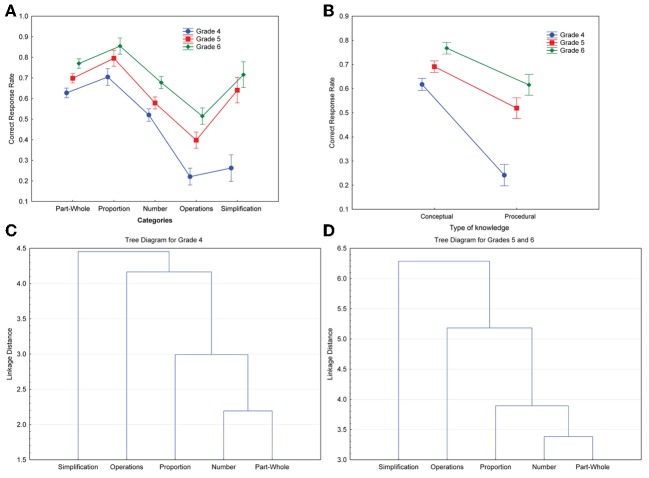
Figure 2.
The top two panels show the interaction between grade and correct response rates for each category (A), and between grade and each type of knowledge (B). Vertical bars denote 95% confidence intervals. The bottom two panels show dendrograms depicting the results of a single linkage hierarchical clustering of each category based on Euclidian distances for Grade 4 (C) and Grades 5 and 6 (D).

