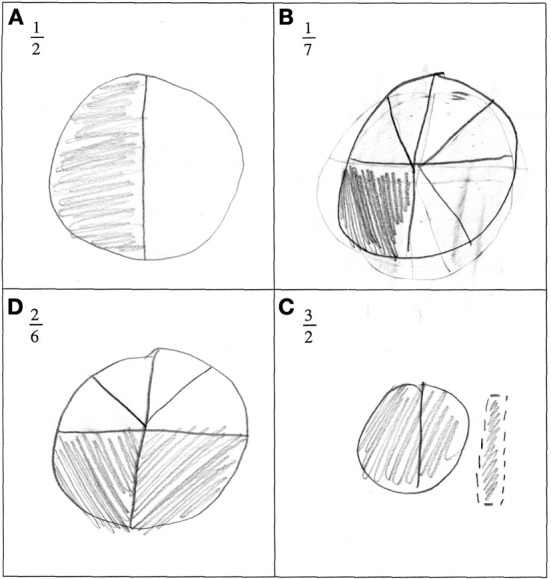
Figure 3.

Illustration of the most common answer when pupils were asked to draw a representation of a given fraction. 90% of them drew continuous quantities such as a circle or a rectangle. In this particular example, only 1/2 was represented correctly (A). Parts of the drawings were unequal for 1/7 and 2/6 (B and C). Different shapes were used for 3/2 (D).
