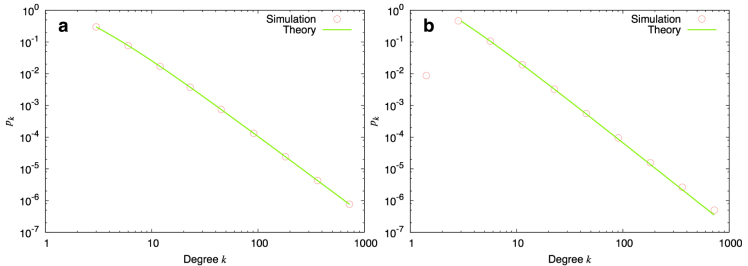
Figure 2.

Comparison between numerical simulations and analytical calculations (a) The points represent the result of logarithmically binning numerical simulations over multiple realizations of the evolution process of a growing network involving pure addition with parameters c = 3, m = 2, a = 0.5, b = 1, s = 0.5, t = 1.0. The final size of the network is n = 105 nodes. The solid line is the theoretical result Eq. (6). The agreement between the two is excellent. (b) Same set of parameters, now including deletion processes with r = 0.2, q = 0.1. The solid line is a fit to the form pk ~ (k + k0)−γ where γ is the theoretical expression (10). Once again the agreement is very good.
