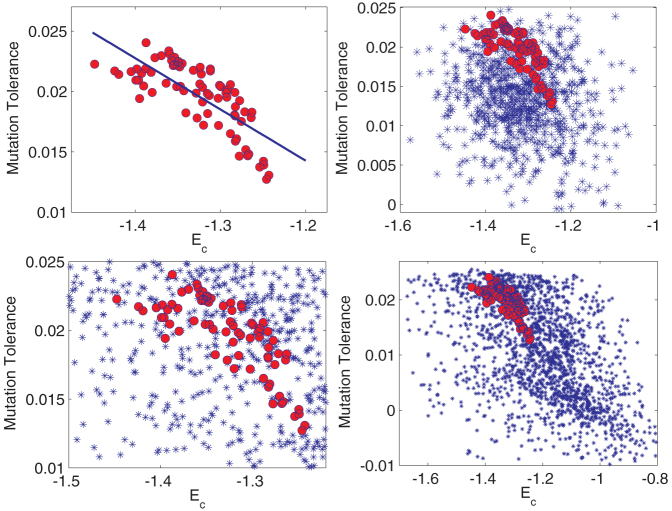
Figure 7. Correlating thermodynamic stability and mutation tolerance.
(Top-Left, A) Thermodynamic stability (Ec) vs mutation tolerance (〈C〉 score). The correlation coefficient is 0.76 ± 0.12. (Top-Right, B) Same plot overlaid on that of random compositions (null-hypothesis) where each amino acid is assigned a random frequency independently drawn from a uniform distribution. There is no correlation for random compositions. Natural composition are tuned to increase tolerance for mutations with increasing thermodynamic stability, since both are under the same selection pressure. (Bottom, C and D) Bias of the genetic code. Same plot as (B) but the blue dots now denote stability and mutation tolerance for compositions constructed from applying the standard genetic code to random DNA sequences, where the frequency of each nucleotide type was drawn independently from a uniform distribution. The correlation between stability and mutation tolerance is negligible for random compositions even with the bias from the genetic code. (Bottom-Left, C) Same plot as D but zoomed in on the region of the natural proteome compositions.

