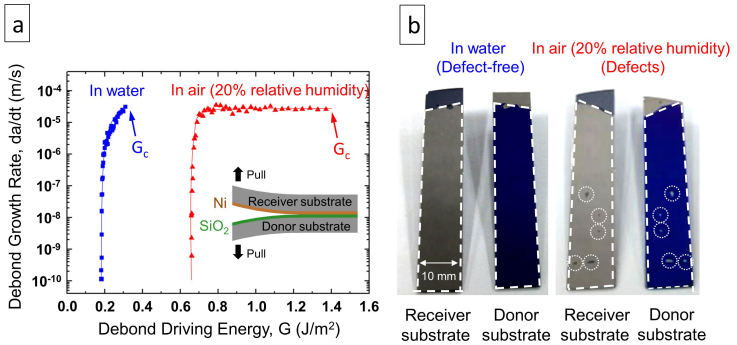
Figure 1. Debond growth behaviors of the Ni-SiO2 interface.
(a) Debond growth rate (da/dt) as a function of the debond driving energy (G) for the Ni-SiO2 interface in water (blue squares) and in air with a 20% relative humidity (red triangles) at 21°C. Inset schematic shows the double-cantilever-beam specimen geometry used for the measurements. (b) Optical inspection of defects for the delaminated surfaces after the debond test in water (left) and in air (right).

