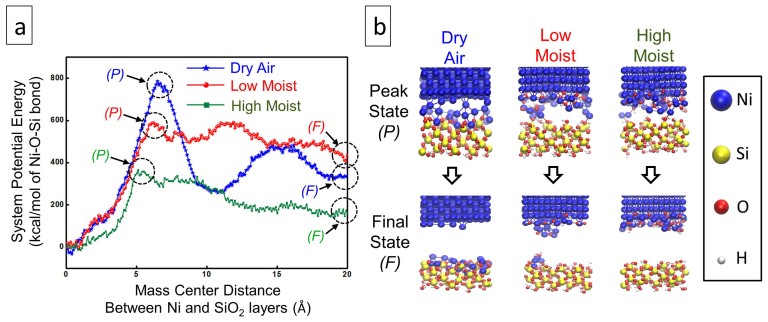
Figure 2. Molecular Dynamics (MD) simulations of the peel-off process.
(a) Comparison of the system potential energy as increasing the mass center distance between Ni layer and SiO2 layer in dry-air (blue dotted line), low-moist (red dotted line) and high-moist (green dotted line) environments. (b) Snapshots corresponding to the peak state (P) and final state (F) in the three different environments, respectively.

