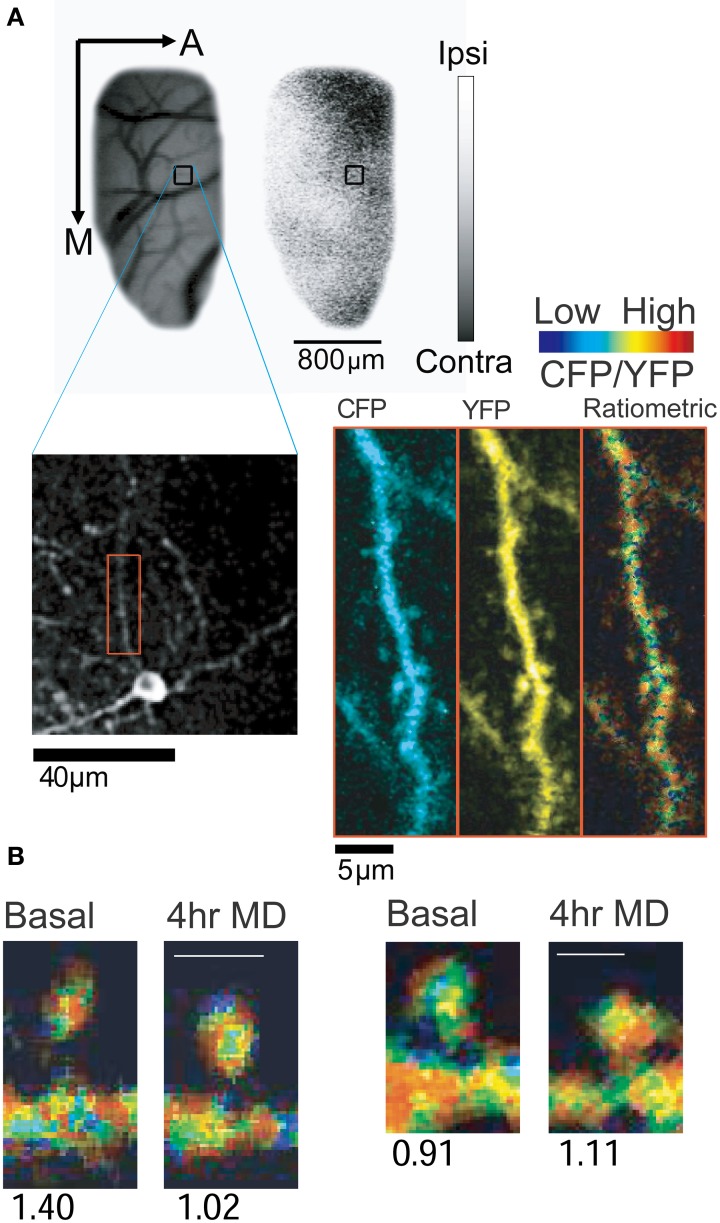
Figure 2.
In vivo imaging of CaMKII activity using Camui. (A) Expression of Camui in ferret visual cortex allowed for visualization of CaMKII activity in dendrites and spines of a neuron in a specific ocular dominance (OD) domain. Blood vessel and OD maps were acquired using intrinsic signal optical imaging (Upper panel: A, anterior; M, medial). Gray scale indicates ocular dominance index (white, ipsilateral eye dominated; black, contralateral eye dominated). Blood vessels map and the low magnification two-photon microscopic image were cross referenced to identify the two-photon images (Lower panel) in a given OD map. A dendritic segment (red box) is magnified (Right) and displayed as channel separated images (CFP and YFP) as well as a ratiometric image in intensity-modulated display mode, indicating the CFP/YFP ratio. Warm hue represents high CaMKII activity. (B) Sample images of spines with decreased (left) or increased (right) CaMKII activity after 4 h of monocular deprivation. Numbers below the images indicate the normalized CFP/YFP ratio, a measurement of FRET signal. From Mower et al. (2011).

