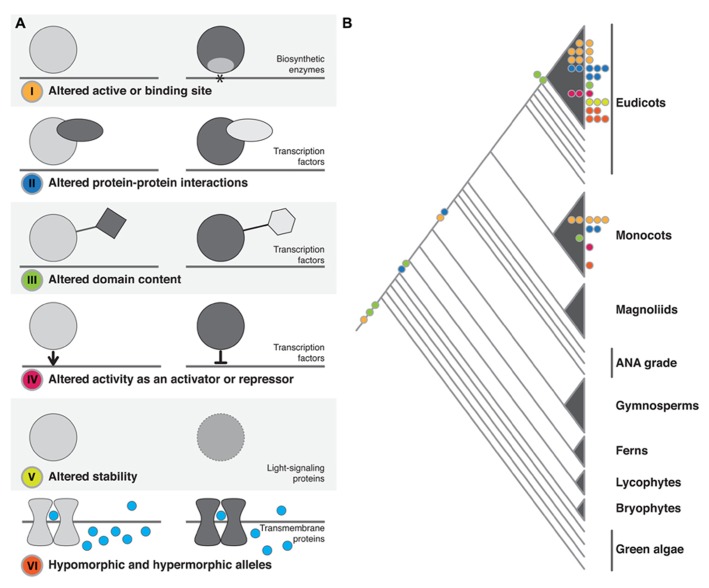
FIGURE 1.
Structural changes observed in plant phenotypic variation and evolution. (A) The six classes of structural change identified. The dominant family of proteins identified as being affected by each class of change is noted. In I–IV the gray line represents DNA, in VI it represents the cell membrane. (B) The approximate phylogenetic placement of described structural changes. Colored circles on branches or within clades represent change at the macroevolutionary level. Colored circles at tips represent microevolutionary changes (color coding as in A).

