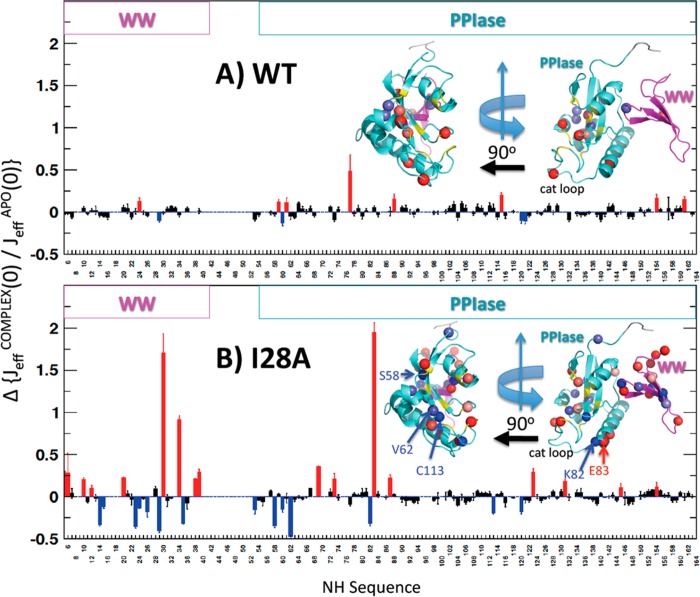
Figure 6.
Site-specific changes in NH backbone dynamics caused by Cdc25C substrate for both WT (top panel (A)) and I28A (bottom panel (B)). All structures are from PDB id 1PIN. Ribbon colors of aquamarine, magenta, and yellow ribbon indicate the PPIase, WW, and PPIase catalytic site regions, respectively. The red/blue spheres are NHs with outlying values of JeffNH,COMPLEX(0)/Jeff(0) (ratios >1 standard deviation from the domain-specific trimmed mean) and thus indicate binding-induced changes in local mobility. The red/blue bars in the bar graphs correspond to the red/blue spheres in the structures. In the bottom panel (B), S58, V62, and C113 are PPIase catalytic site residues that show increased subnanosecond mobility upon substrate binding for I28A but not for WT. K82 and E83, at the juncture between the catalytic loop and the long helix α1, also show dynamic changes not found in the WT.

