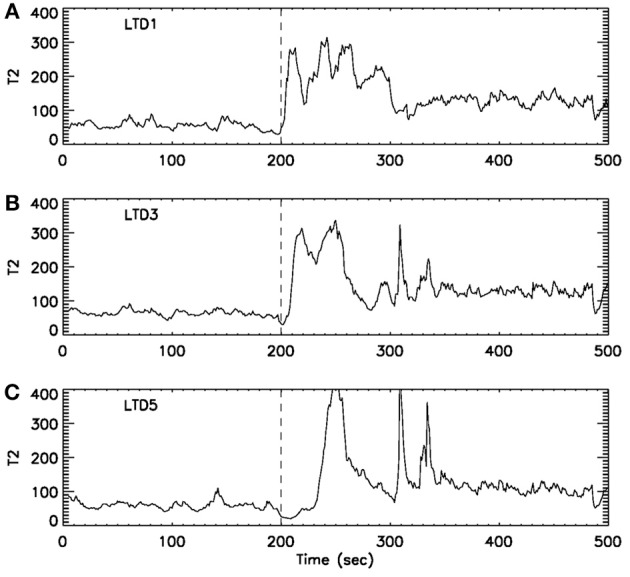
Figure 8.

curves for EEG signals measured by three electrodes. The dashed vertical line indicate the seizure starting position around 200 s. The seizure lasted for about 2 min. Note that from (A) LTD1 to (B) LTD3, the seizure activity is delayed about 10 s, while from (A) LTD1 to (C) LTD5, the seizure activity is delayed about 30–40 s.
