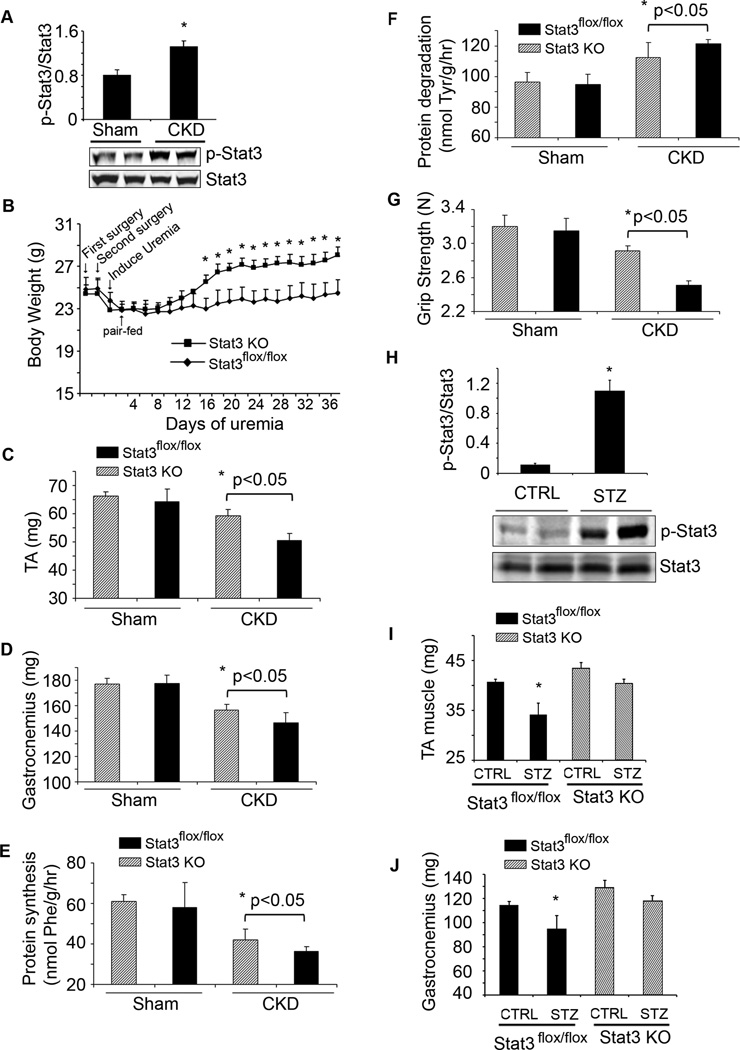
Figure 2. Muscle-specific Stat3 knockout in mice suppresses CKD or streptozotocin-induced muscle wasting.
A. Density of p-Stat3 corrected for total Stat3 in lysates of gastrocnemius muscles (upper panel; n=5 mice/group; *p<0.05 vs. sham control mice). Also shown are representative western blots of p-Stat3 (lower panel). B. Changes in body weights of Stat3 KO and Stat3flox/flox, control mice over 5 weeks following creation of CKD (n=10 pairs of mice; *p<0.05 vs. Stat3flox/flox). C & D. Average weights of mixed fiber gastrocnemius and tibialis anterior (TA) muscles (n=10 mice/group). E&F. EDL muscles from sham or CKD mice and either Stat3flox/flox or Stat3 KO were isolated. Rates of protein synthesis (E) and protein degradation (F) were measured (n=20 EDL muscles from 10 mice/group). G. Muscle force of each mouse used in figure 2B was measured on four consecutive days. The average muscle force (in Newtons) is shown (n=10 mice/group). H. Representative western blots of p-Stat3 in lysates of gastrocnemius muscles of acutely diabetic (STZ) and control mice. Bar graph shows the densities of p-Stat3 corrected for that of Stat3 (n=10 mice/group; *p<0.05 vs. CTRL mice). I&J. Average weights of the mixed fiber tibialis anterior (TA) and gastrocnemius muscles from both legs (n=10 mice/group; *p<0.05 vs. control Stat3flox/flox). Values are means±SEM. (See also Figure S2)

