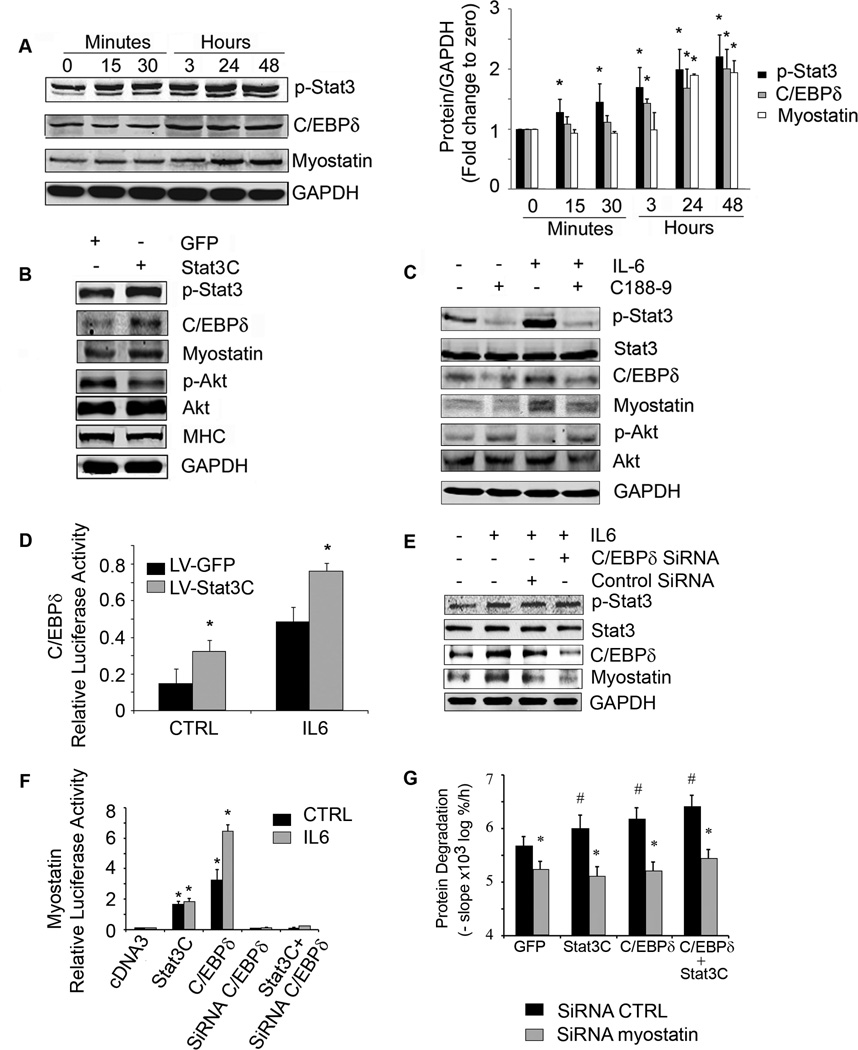
Figure 4. Stat3 activation in C2C12 myotubes increases the expression of C/EBPδ and myostatin.
A. Representative western blots from C2C12 myotubes treated with IL-6 (100 ng/ml) for different times (left panel). Fold-changes in the densities of proteins corrected for GAPDH at different times calculated from values at time zero (right panel), n=3 repeats; *p<0.05 vs. time zero. B. C2C12 myotubes were infected with a lentivirus expressing constitutively active Stat3 (Stat3C-GFP). A representative western blot for the indicated proteins is shown. C. C2C12 myotubes were treated with or without C188-9 for 2 h before adding IL-6 (100 ng/ml) for 24 h. A representative western blot for the indicated proteins is shown. D. C2C12 myoblasts were co-transfected with a plasmid expressing C/EBPδ promoter-driven luciferase, Renila plus a lentivirus expressing Stat3C-GFP and treated with or without IL-6. Dual luciferase activity was measured (n=3 repeats; *p<0.05 vs respective GFP control). E. C2C12 myoblasts were transfected with control siRNA or C/EBPδ siRNA and after differentiation to myotubes were treated with or without IL-6. Representative western blots of Stat3, C/EBPδ and myostatin are shown. F. C2C12 myoblasts were co-transfected with a plasmid expressing the myostatin promoter-driven luciferase plus plasmids (cDNA3 control, Stat3C, C/EBPδ, C/EBPδ siRNA or Stat3C plus C/EBPδ siRNA) and treated with or without IL6. Luciferase activity was measured (n=3 repeats; *p<0.05 vs. cDNA3 CTRL). G. C2C12 myoblasts were transfected with lentivirus expressing a siRNA to myostatin. Myoblasts exhibiting suppression of myostatin were selected and then differentiated after they had been transfected with plasmids expressing Stat3C, C/EBPδ or Stat3C plus C/EBPδ. In these cells, we measured protein degradation (upper panel; n=6 repeats, #p<0.05 vs GFP control, *p<0.05 vs siRNA CTRL). Western blots of proteins expressed in response to tranfections were shown in supplemental figure S7. Values are means±SEM. (See also Figure S3)

