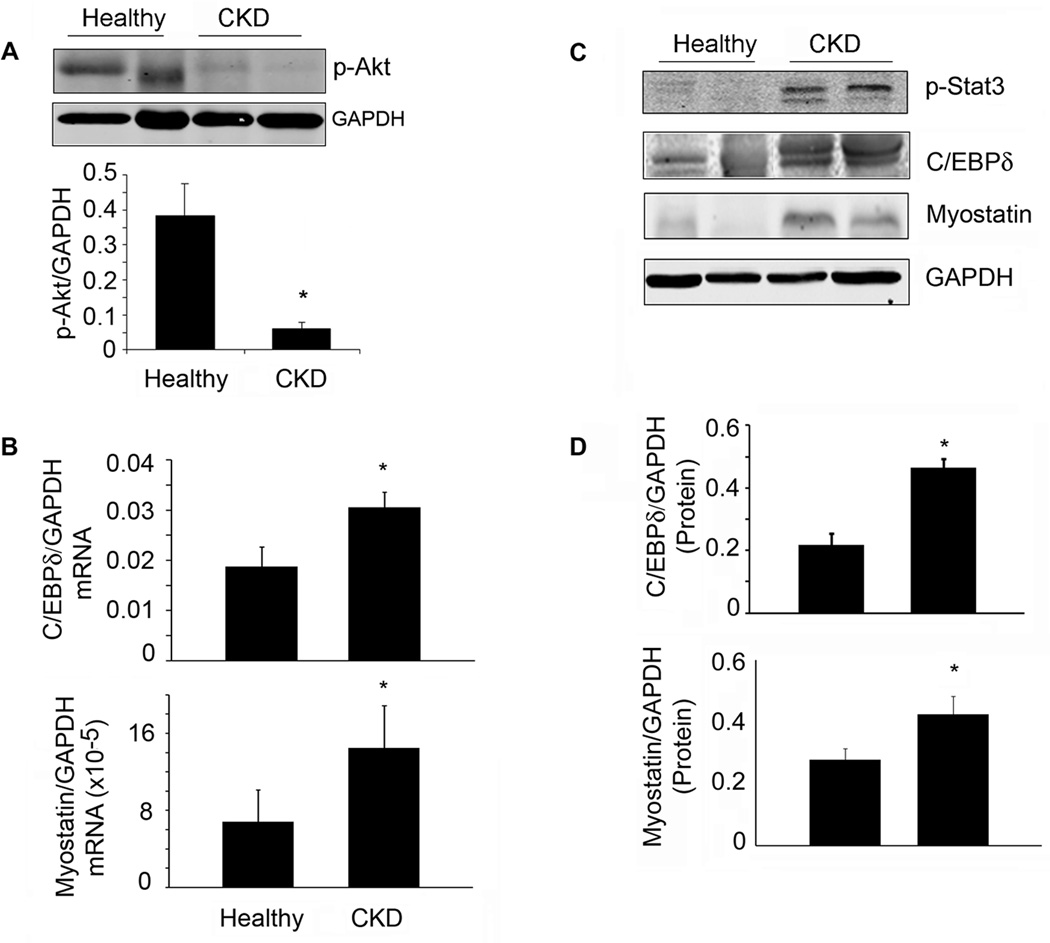
Figure 7. Evidence for a p-Stat3, C/EBP δ and myostatin pathway in muscles of patients with CKD.
A. Representative western blots of p-Akt from muscle biopsies of healthy control or CKD patients. Bar graph shows the densities of p-Akt corrected for GAPDH (lower panel; n=4 CKD patients and 3 healthy subjects). B. Levels of mRNAs of C/EBP δ or myostatin were analyzed by RT-PCR from muscle biopsies of healthy control or CKD patients (n=5 control subjects and 9 CKD patients). C. Representative western blots of the indicated proteins from muscle biopsies from healthy control or CKD patients. D. The band densities were quantified after correction for GAPDH (n=3 pairs for CEBP δ; n=8 pairs for myostatin). Values are means±SEM. *p<0.05 vs. healthy controls.

