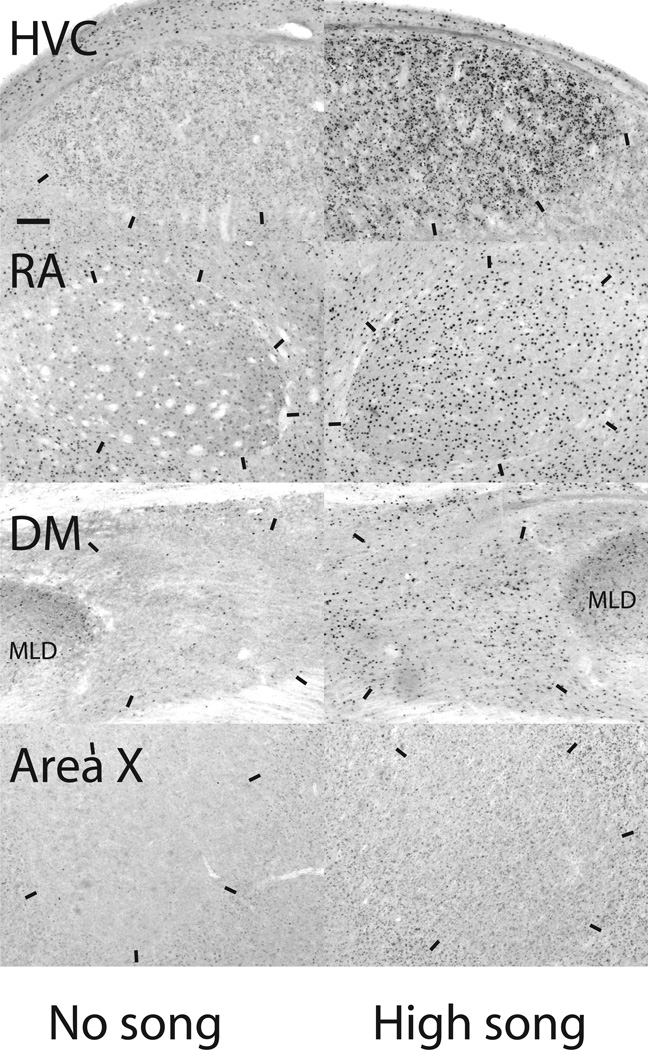
Figure 2.
Representative photomicrographs of vocal control regions. Right images are from individuals that produced higher numbers of songs (in HVC, longer songs), left images from individuals that produced no song (in HVC, short song). Horizontal bar in HVC is 100εm, ticks indicate boundaries of regions. MLD = nucleus mesencephalicus.

