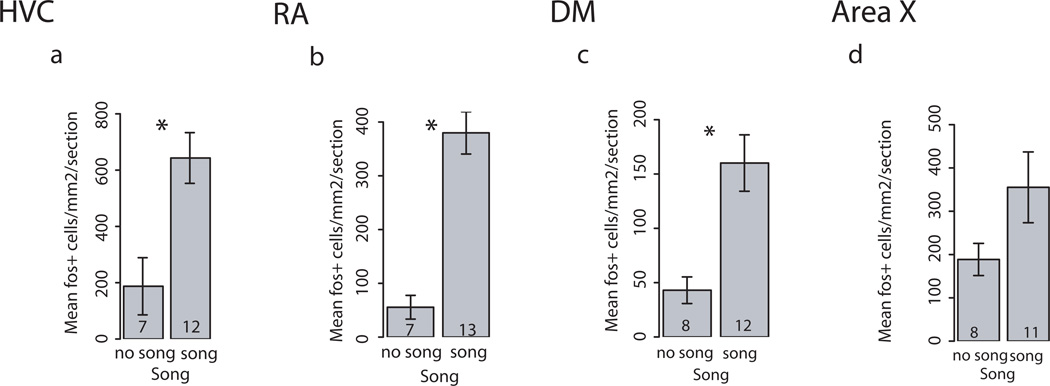
Figure 3.
Fos-ir in vocal control regions as a function of singer status, comparing individuals that sang at least one song with those that did not sing. Y-axis shows density of fos-positive cells in the measurement area, averaged over three consecutive sections and both left and right sides. Asterisks indicate significant differences at α = 0.05.

