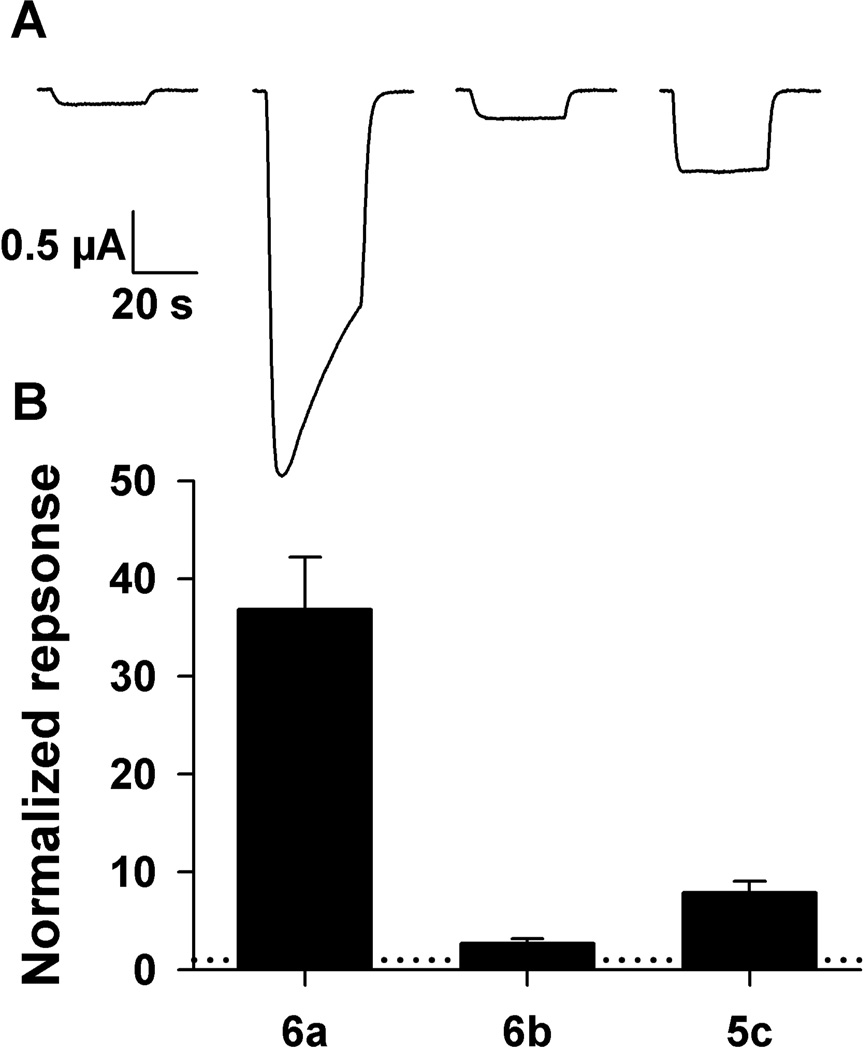
Figure 3.
Direct quantitative comparison of steroids 6a, 6b and 5c at 10 µM on responses to GABA in Xenopus oocytes expressing α1β2γ2L GABAA receptor subunits. A. Responses of to 2 µM GABA alone (left trace) and to GABA co-applied with 10 µM each of 6a (second trace), 6b (third trace) and 5c (right trace). All responses are from the same oocyte. B. Summary of responses in which 6a, 6b and 5c were tested within oocytes, normalized to the response of GABA alone in each oocyte. The normalizing response is indicated with a dotted horizontal line at y = 1 (N = 4). Error bars are SEM.

