
Figure 2.
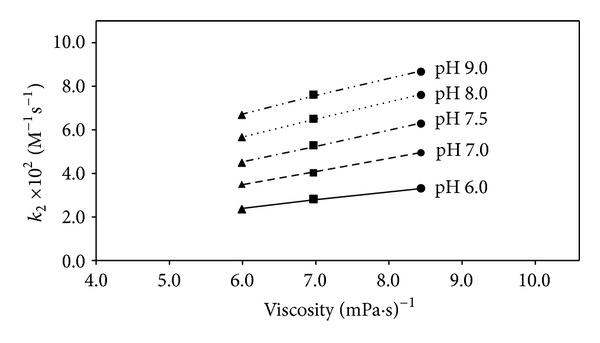
Plots of k 2 for the polymerization of HEMA (1–3 M) in presence of RF/TEOHA versus inverse of solution viscosity. Symbols are as in Figure 1.
Official websites use .gov
A
.gov website belongs to an official
government organization in the United States.
Secure .gov websites use HTTPS
A lock (
) or https:// means you've safely
connected to the .gov website. Share sensitive
information only on official, secure websites.
Plots of k 2 for the polymerization of HEMA (1–3 M) in presence of RF/TEOHA versus inverse of solution viscosity. Symbols are as in Figure 1.