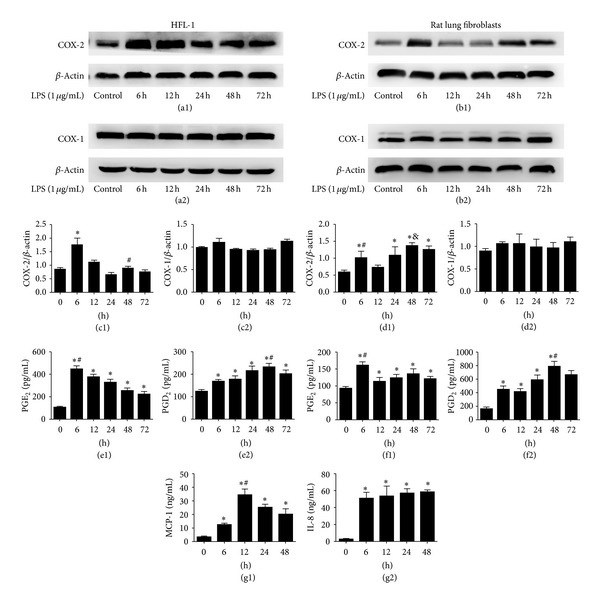
Figure 1.

The effect of LPS on COX-1, COX-2, PGE2, PGD2, MCP-1, and IL-8 expression in lung fibroblasts. ((a1), (a2), (c1), (c2)) HFL-1 cells were incubated with LPS (1 μg/mL) for 6, 12, 24, 48, and 72 hours. The expression of COX-1 and COX-2 protein was assessed by western blot and analysed by densitometry compared to β-actin expression. The expression of COX-2 protein in HFL-1 cell line was increased and peaked both at 6 hours and 48 hours after LPS stimulation (∗ P < 0.05 versus control, 12, 24, 48, and 72 hours groups, # P < 0.05 versus 24 hours group). However, no significant change in the protein expression of COX-1 was observed after treatment with LPS in HFL-1 cell line. ((e1), (e2)) Supernatants were collected after LPS (1 μg/mL) treatment for 6, 12, 24, 48, and 72 hours. PGE2 protein was measured by ELISA. Data are expressed as mean ± SE for each group (∗ P < 0.05 versus control, # P < 0.05 versus 12, 24, 48, and 72 hours groups). PGD2 protein was also assayed by ELISA. Data are expressed as mean ± SE for each group (∗ P < 0.05 versus control, # P < 0.05 versus 6, 12, 72 hours groups). ((b1), (b2), (d1), (d2), (f1), (f2)) We also dulicated our test in primary rat lung fibroblasts ((b1), (d1)), (∗ P < 0.05 versus control, # P < 0.05 versus 12 hour group, & P < 0.05 versus 6, 12, 24, and 72 hours groups). ((b2), (d2)) No significant change in the protein expression of COX-1 was observed after treatment with LPS in primary rat lung fibroblasts (∗ P < 0.05 versus control, # P < 0.05 versus 12, 24, 72 hours groups, (f1)) and (∗ P < 0.05 versus control, # P < 0.05 versus 6, 12, 24, 72 hours group, (f2)). All experiments were repeated in triplicate. ((g1), (g2)) Supernatants were collected after LPS (1 μg/mL) treatment for 0, 6, 12, 24, and 48 hours in primary rat lung fibroblasts. MCP-1 protein was measured by ELISA. Data are expressed as mean ± SE for each group (∗ P < 0.05 versus control, # P < 0.05 versus 6, 24, 48 hours groups). IL-8 protein was also assayed by ELISA. Data are expressed as mean ± SE for each group (∗ P < 0.05 versus control).
