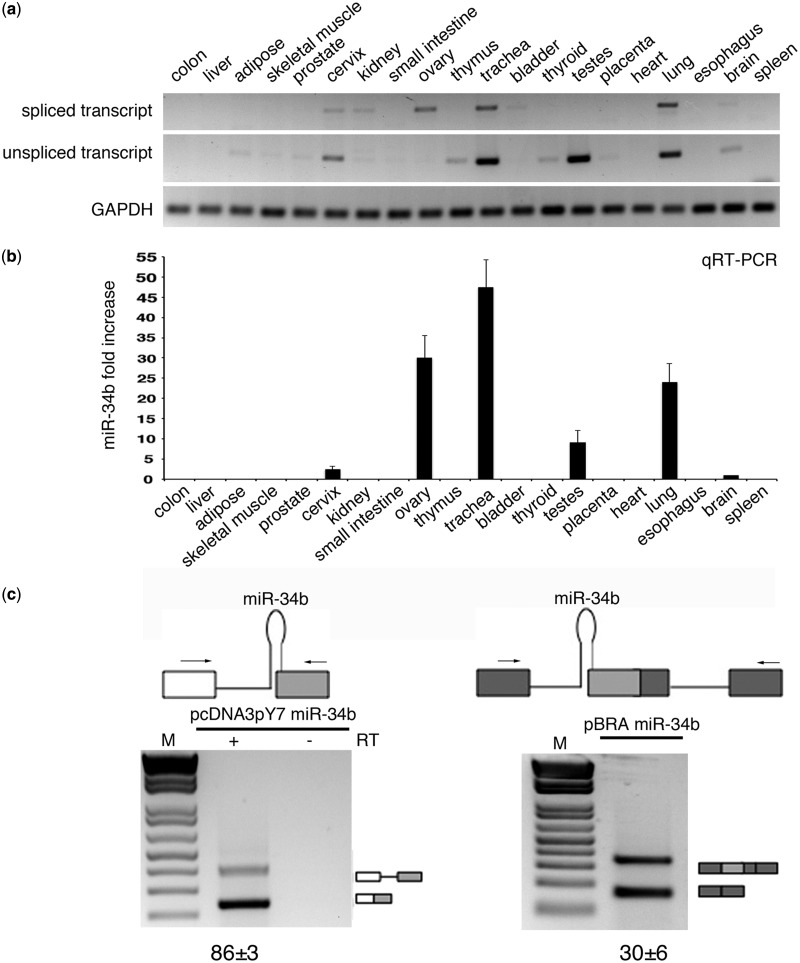
Figure 2.
SO pri-miR-34b transcript is spliced in vivo and in minigene systems. (a) RT-PCR profile of miR-34b transcript in 20 human tissues. The upper panels show amplification of the spliced and unspliced transcripts, the lower one amplification of the control gene GAPDH. The identity of the bands was verified through direct sequencing, and quantitative analysis by qRT-PCR is provided in Supplementary Figure S3. (b) qRT-PCR analysis of the mature miR-34b in the different human tissues. Values are normalized for the GAPDH gene. miR-34b abundance in brain is set to 1. (c) Schematic representation of the minigene systems: on the left, pcDNA3pY7 miR-34b and on the right pBRA miR-34b. Thin lines represent introns and miR-34b hairpin. Boxes indicate exons, and, in particular, the light grey box is exon2 of miR-34b. Arrows indicate primers used for PCR analysis. On the bottom, the splicing profile of the two systems after transfection in HeLa cells. The identity of the bands is depicted on the right and was verified through direct sequencing. The numbers under the panel indicate the percentage of splicing (for pcDNA3pY7 miR-34b) or exon inclusion (pBRA miR-34b) ± SD.

