Figure 4.
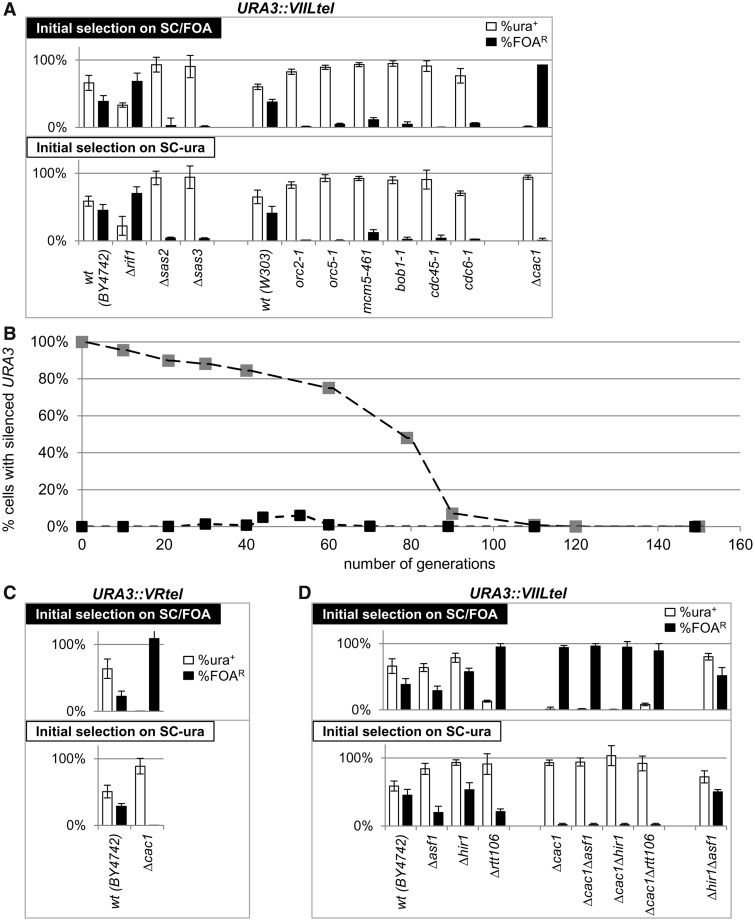
Assessment of the frequency of conversions at the VIIL and VR telomeres. (A) Frequency of conversions at the VIIL telomere. URA3 was inserted in the VIIL telomeres of the strains shown below the graphs. Cells were selected on SC/FOA (upper graph) or SC-ura (lower graph) and single colonies were transferred to YPD medium and grown for ∼15–20 generations at 23°C. The cultures were serially (1:10) diluted and spotted on SC, SC-ura and SC/FOA plates. The colonies were counted, and the percentage of URA+ (open columns) and FOAR (black columns) cells were calculated for at least six independent cultures and plotted. Data are from Table 2. (B) Long-term rates of conversion in Δcac1 cells. Cells were selected as in Figure 4A and grown for 160 generations. Aliquots of the cultures were removed at known generations, and the percentage FOAR cells was measured and plotted. Best fit algorithm of the conversion rates for the first 50 generations produced values of CS→A = 0.44% and CA→S = 0.06%. Conversion rates in later generations were not measured. One of two independent long-term experiments is shown. (C) Frequency of conversions at the VR telomere. URA3 was inserted in the VR telomeres of BY4742 and Δcac1 strains. Analyses were performed as in Figure 4A. (D) Frequency of conversions at the VIIL telomere in single and double histone chaperone mutants. Analyses were performed as in Figure 4A.

