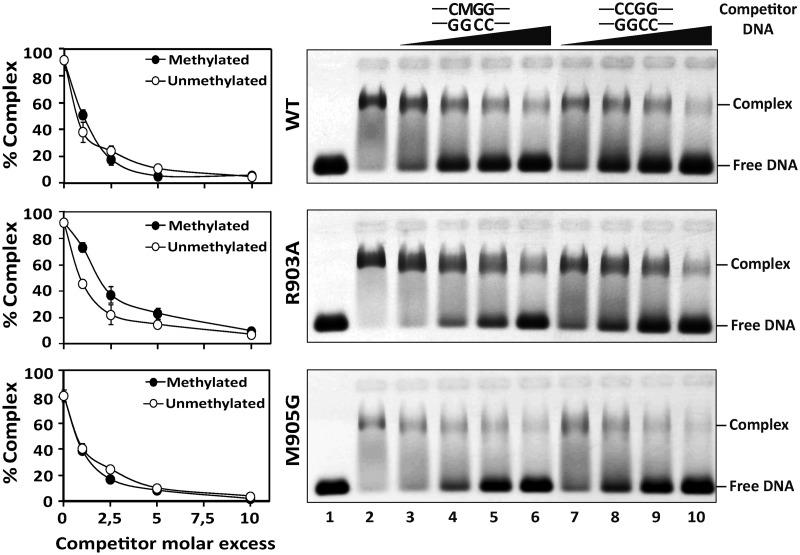
Figure 5.
Binding of R903A and M905G mutant proteins to methylated and nonmethylated DNA. WT ROS1 (upper panel), R903A (center panel) or M905G (lower panel) proteins (130 nM) were incubated at 25°C for 1 h with 100 nM labeled methylated DNA containing a single 5-meC:G pair, in the presence of increasing amounts (0, 0.1, 0.25, 0.5 and 1.0 μM) of either methylated (lanes 2–6) or nonmethylated (lanes 2 and 7–10) unlabeled competitor DNA. After nondenaturing gel electrophoresis, the gel was scanned to detect fluorescein-labeled DNA. Protein–DNA complexes were identified by their retarded mobility compared with that of free DNA, as indicated. Graphs on the left show the percentage of remaining complex versus competitor molar excess ratios. Values are mean ± SE (error bars) from three independent experiments. M indicates 5-meC.

