Figure 6.
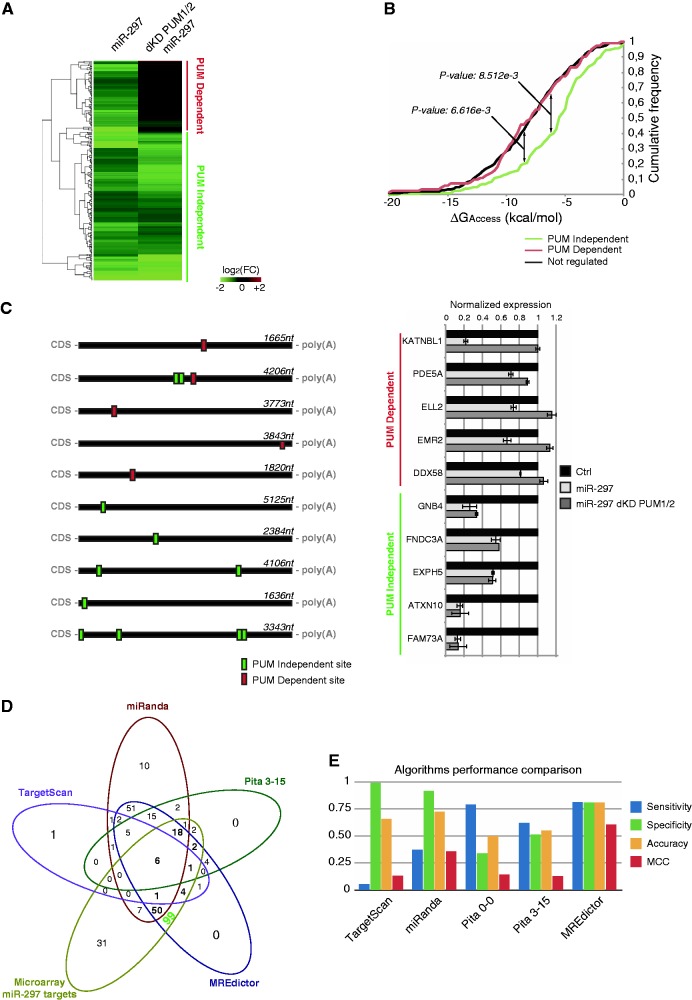
Microarray validation of MREdictor predictions. (A) Heatmap showing the two clusters of genes that emerge after microarray analysis of HEK293 cells transfected with miR-297 in the presence or absence of PUM1/2. In the PUM-dependent cluster, the miR-297-mediated repression is abolished (or significantly reduced) following PUM1/2 double knockdown. (B) Cumulative frequency plot of the PUM-dependent, PUM-independent and non-regulated gene clusters. Genes within the PUM-dependent cluster are more likely to reside within poorly accessible regions compared with the PUM-independent cluster, which is similar to the non-regulated genes. The P-value is given by the Welch t-test. (C) Schematic representation of the 3′-UTR of five genes from each cluster, and RT-PCR validation of microarray analysis. Data are averaged over triplicate experiments, and error bars are given for the S.Ds. (D) Venn diagram showing the overlap between the predictions for miR-297 of different tools and MREdictor compared with microarray downregulated genes. MREdictor successfully predicts 99 unique targets, which are not predicted by other programs. (E) Comparison of standard performance measures of state-of-the-art algorithms and MREdictor predictions for miR-297, calculated over microarray data.

