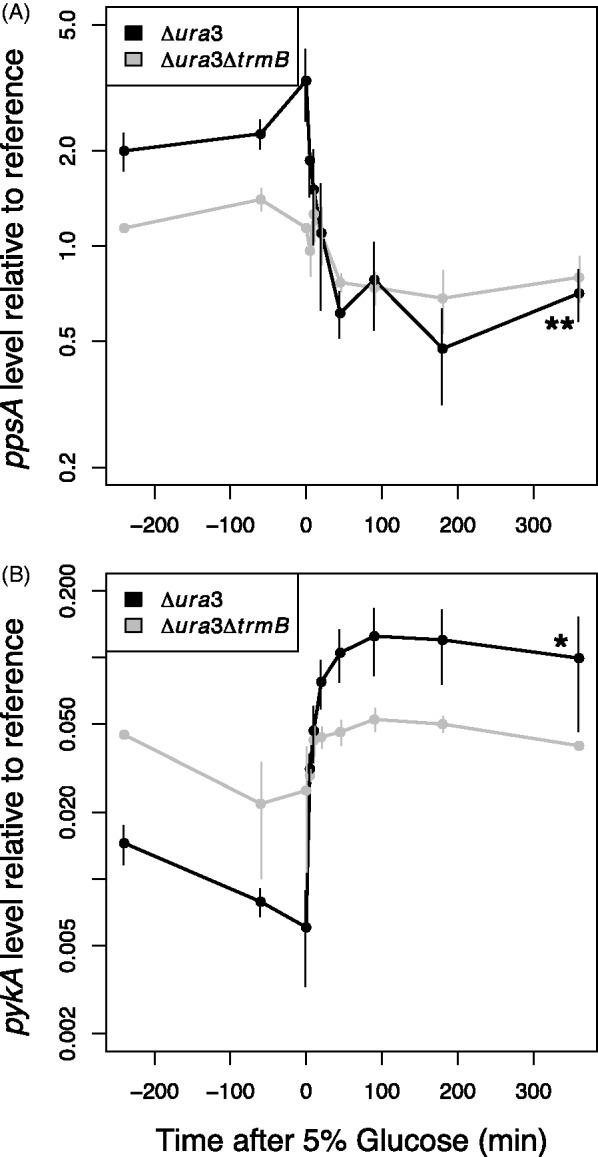
Figure 1.

ppsA and pykA gene expression exhibits state-change dynamics in response to glucose perturbation when TrmB is present. Gene expression of ppsA (A) and pykA (B) to a 5% glucose stimulus in the Δura3 (black lines) and Δura3ΔtrmB (gray lines) strains were measured by RT-qPCR and are shown plotted on a logarithmic axis. Error bars represent the standard error from the average of at least two biological replicate experiments. Asterisks indicate significance of the difference in expression level between the beginning and the end of the time course; * significant at P < 0.05; ** significant at P < 0.01; *** significant at P < 0.001.
