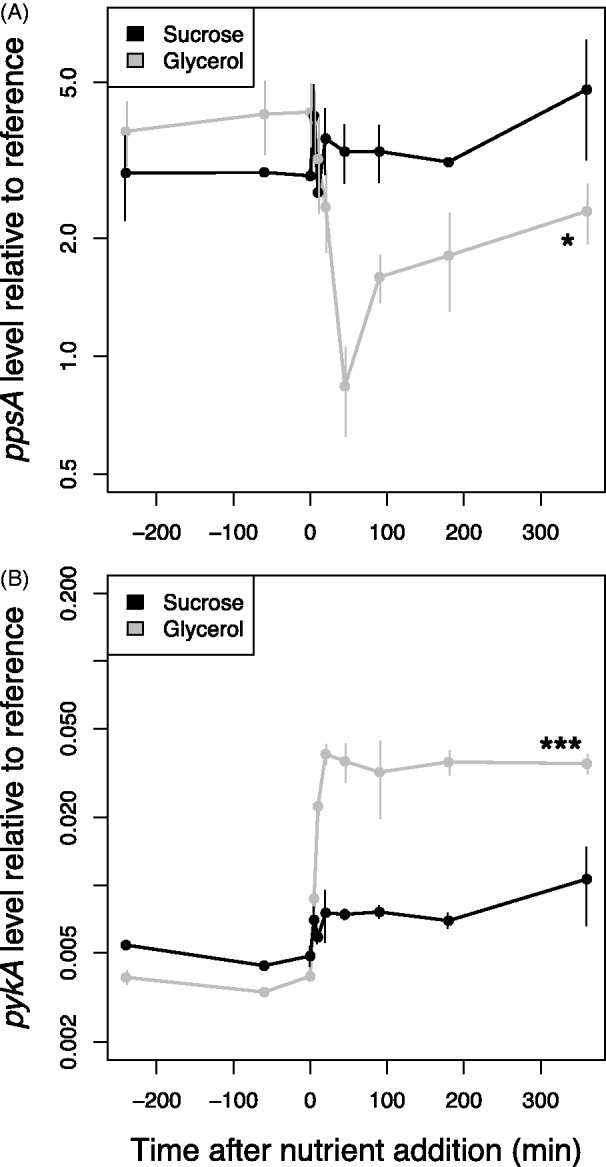
Figure 2.

ppsA (A) and pykA (B) do not respond significantly to 5% sucrose in the Δura3 strain (black lines). ppsA and pykA respond to 0.167% glycerol stimulus in the Δura3 strain (gray lines). Gene expression was measured by RT-qPCR and is shown plotted on a logarithmic axis. Asterisks indicate significance of the difference in expression level between the beginning and the end of the time course; * significant at P < 0.05; ** significant at P < 0.01; *** significant at P < 0.001.
