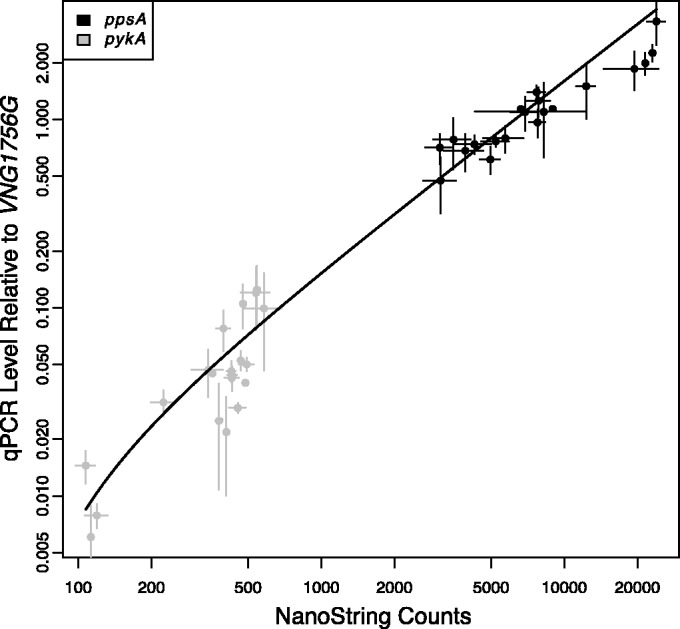
Figure 3.

NanoString gene expression measurements are tightly correlated with qPCR measurements. mRNA levels for ppsA (black points) and pykA (gray points) were measured by RT-qPCR and NanoString. Both RT-qPCR and NanoString are shown plotted on a logarithmic axis. Error bars represent standard error from two replicates of NanoString and at least two replicates of RT-qPCR.
