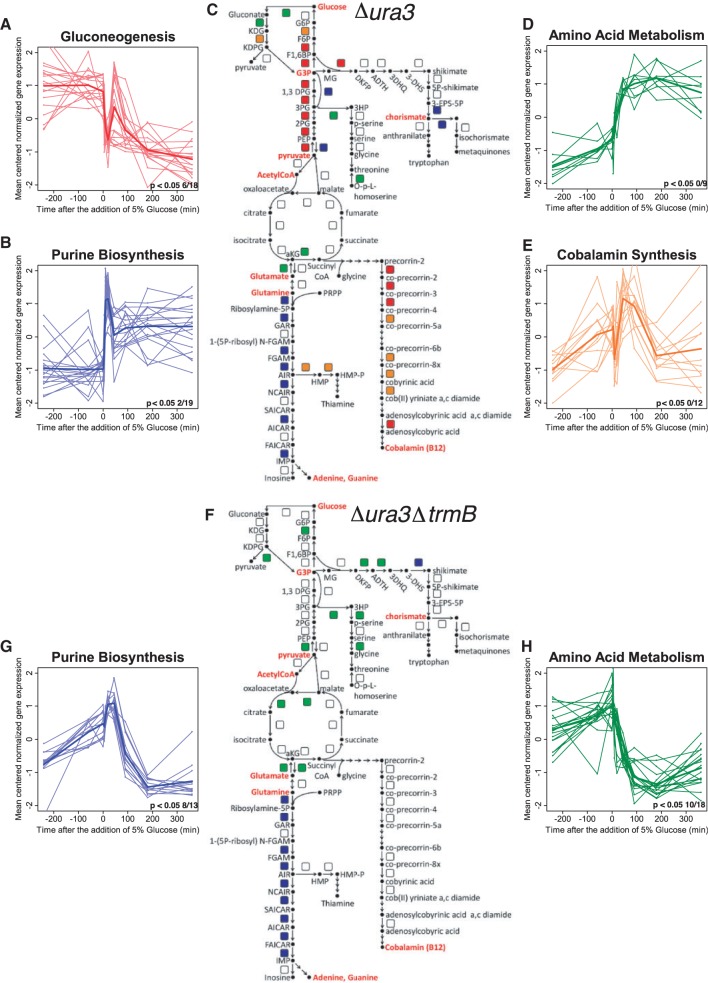
Figure 4.
TrmB is required for metabolic modularity in H. salinarum metabolism. Figure depicts k-means clustering and using eight clusters and Pearson correlation as a scoring metrics on the Δura3 (C) and Δura3ΔtrmB (F) data. Only clusters enriched (P < 0.01) for COG biological function categories are shown for each strain. Four clusters are enriched in genes involved in specific pathways in Δura3 (A, B, D and E), whereas only two clusters are thus enriched in Δura3ΔtrmB (G and H). Metabolic maps (C and F) depict enzyme-coding genes as colored squares, with colors corresponding to cluster graphs. Each cluster graph depicts gene expression data for individual genes (thinner lines) and the mean expression profile for the cluster (thicker lines). The number of genes in every cluster that shows significant (P < 0.05) 1.5-fold over expression by the one-sided Welch t-test is listed in the lower right-hand corner of each expression graph. Metabolite abbreviations used in (C and F) are listed in Supplementary Table S7. In all, 30 of the 100 genes analyzed by NanoString are not represented on the metabolic map for the sake of clarity.

