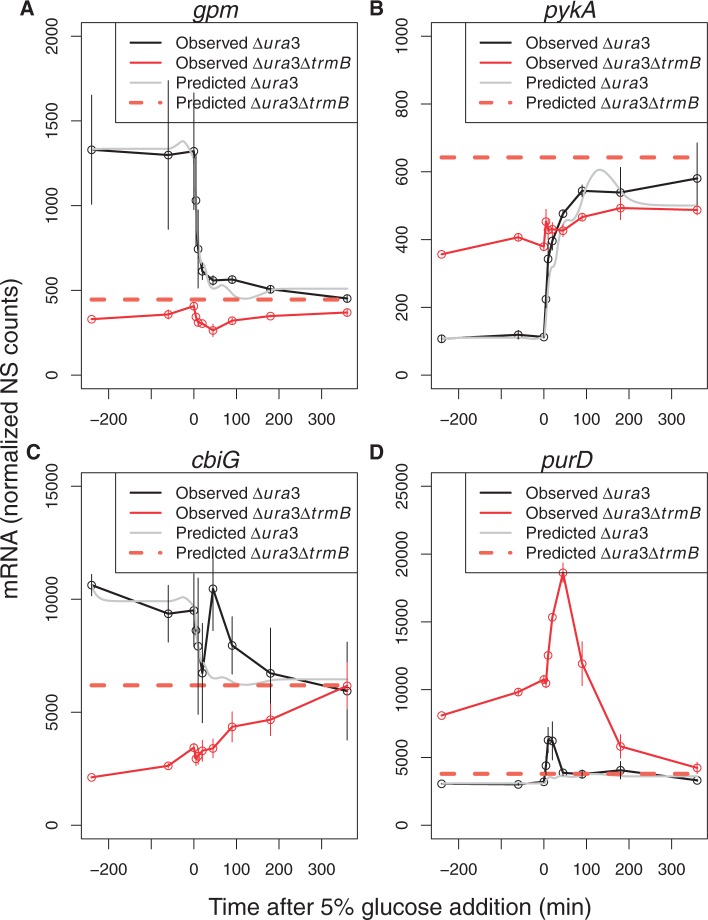
Figure 6.
ODE model fit to NanoString gene expression data in response to glucose is predictive of gene expression in the Δura3 (parent strain) and Δura3ΔtrmB mutant background for some but not all genes. (A) Phosphoglycerate mutase (gpm). (B) Pyruvate kinase (pykA). (C) Cobalamin biosynthesis gene (cbiG). (D) 5-phosphoribosylglycinamide (GAR) synthetase (purD, purine biosynthesis pathway). Black lines represent mRNA level in the Δura3 strain. Red lines represent mRNA level in the ΔtrmB strain. The gray line and the dotted orange line show model fits for Δura3 and Δura3ΔtrmB, respectively. Error bars depict standard error from the average of two biological replicates of the gene expression data. Model fits to data for the remaining 96 genes are exhibited in Supplementary Figure S1.

