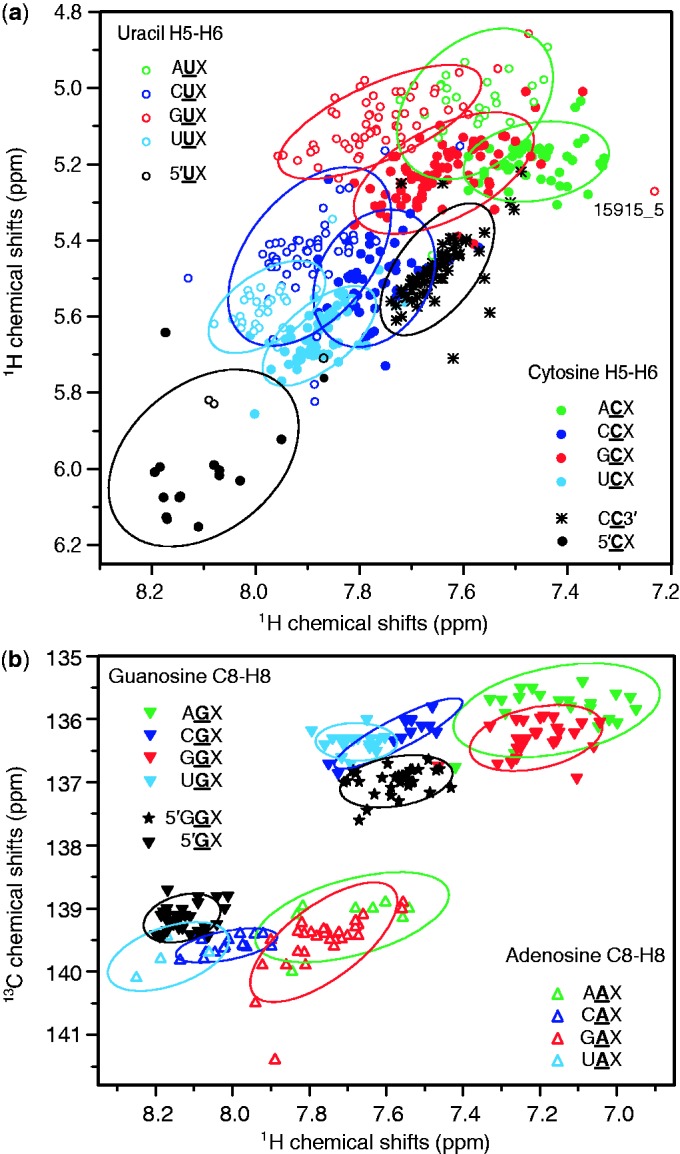
Figure 2.

Two-dimensional chemical shift statistics for the central nucleotide of Watson–Crick base-paired triplets. Scatter plots display the clusters of chemical shift correlations for the different categories. Bivariate normal distributions are represented by ellipses at 86% probability. (a) H5–H6 chemical shift correlations that are found in a 2D 1H–1H TOCSY spectrum. (b) C8–H8 chemical shift correlations that are found in a 2D 1H–13C HSQC spectrum.
