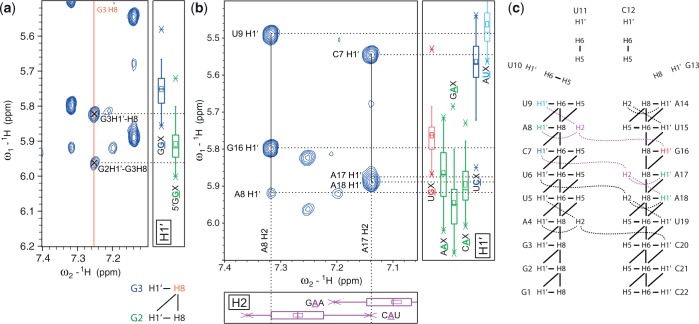
Figure 4.
Application of 1D statistics during assignment walks. (a) Part of a 2D NOESY spectrum of TASL1 showing cross-peaks of the G3 H8 resonance that was already assigned based on 2D statistics. As illustrated schematically (bottom) the expected NOE correlations include two cross-peaks to H1′ resonances, one to nucleotide G2 and one to G3. The 1D statistics (right) help here to differentiate between the two cross-peaks assigning them to G2 H1′–G3 H8 and G3 H1′–H8. Only one of the 1H chemical shifts lies within the borders of the GGX statistic and is therefore assigned to G3 H1′. The other 1H chemical shift lies within the borders of the 5′GGX statistic and is assigned to G2 H1′. (b) Cross-peaks of two adenosine H2 resonances in the 2D NOESY spectrum of TASL1. At the bottom and on the right 1D statistics of the relevant triplets are displayed. (c) Scheme of TASL1 showing expected NOE correlations. The two adenosine H2 resonances and their correlations visible in the NOESY spectrum are colored in magenta. The involved H1′ resonances are color-coded as the chemical shifts statistics in panel b.

