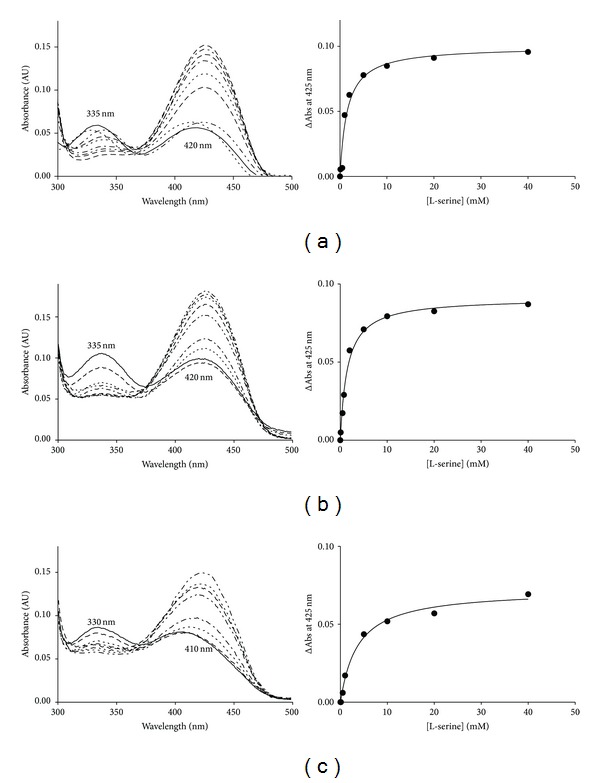
Figure 4.

UV-visible analysis of Sp SPT wild-type and mutant mimics. Absorbance spectra of (a) Sp SPT wild type, (b) SPT V246M, and (c) SPT G385F. In the wild-type spectrum (a), the enolimine (335 nm) and ketoenamine (420 nm) forms of the external aldimine are shown. The solid line in each spectrum is the holoform of the enzyme (40 μM SPT, 20 mM potassium phosphate buffer (pH 7.5), and 150 mM NaCl, 25°C). Increasing concentrations of L-serine were added (0, 0.5, 1, 2, 5, 10, 20, and 40 mM; dotted and dashed lines), and the spectrum was recorded after 15 minutes.
