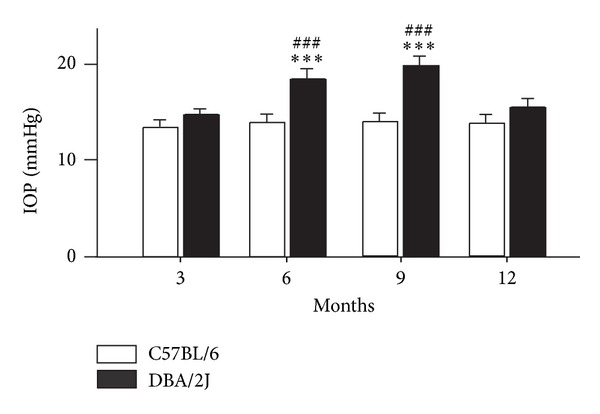
Figure 1.

Changes of IOPs in C57BL/6 and DBA/2J mice at various ages. Bar chart showing changes of the average IOPs in C57BL/6 and DBA/2J mice at ages of 3 (n = 24), 6 (n = 18), 9 (n = 12) and 12 (n = 6) months. All data are presented as mean ± S.E.M. ***P < 0.001 versus 3-month-old C57BL/6 mice; ### P < 0.001 versus age-matched C57BL/6 mice.
