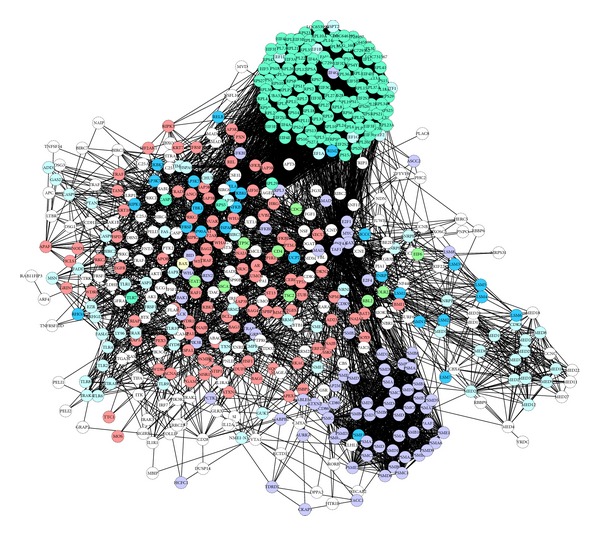
Figure 1.

Protein-protein interaction (PPI) network for deficiency pattern-related genes. Cycles represent nodes. All edges represent interactions between the nodes. The green nodes represent cold pattern-related molecules; plum stands for hot pattern-related molecules; light blue stands for deficiency pattern; yellow stands for both cold and hot patterns; bluish green stands for both cold and deficiency patterns; deep blue stands for both hot and deficiency patterns; dark blue stands for cold, hot, and deficiency patterns.
