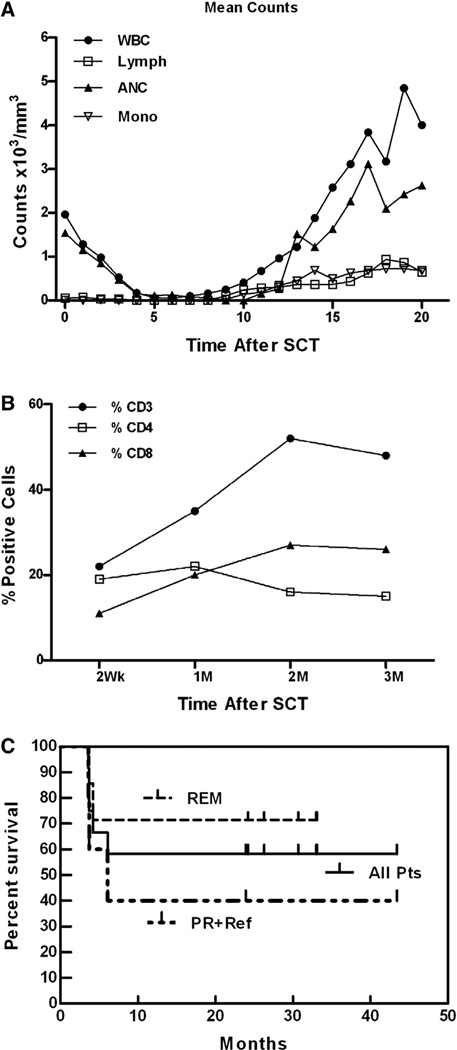
Figure 2.
Engraftment. (A) Daily mean absolute white blood cell count, lymphocyte, absolute neutrophil, and monocyte counts for 12 patients. (B) Flow cytometry performed on PBMCs from patients at the indicated time points after SCT shows mean proportions of CD3+, CD4+, and CD8+ T cells after SCT. (C) Overall survival of 12 patients transplanted for NHL. The Kaplan-Meier curve is presented for the entire population (All patients), the subgroup of patients who underwent transplantation in remission (REM), and the subgroup of patients who were transplantation inpartial remissionor had refractory disease (PR + Ref).

