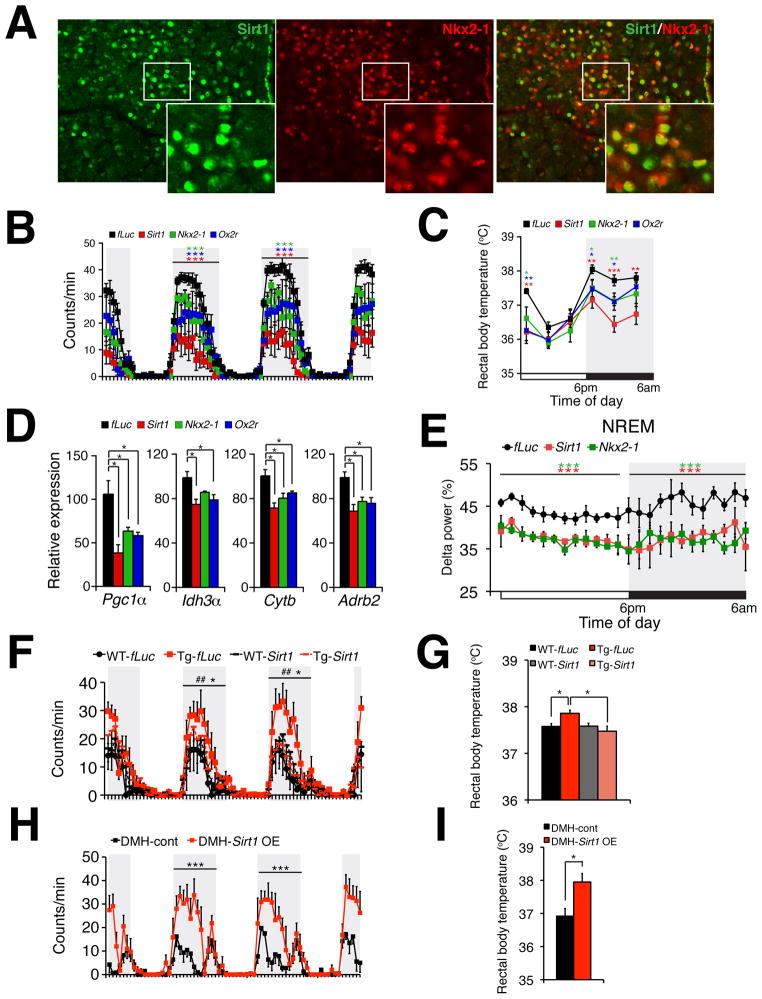
Figure 5. Sirt1, Nkx2-1, and their target gene product Ox2r in the DMH and LH are required to maintain physical activity, body temperature, skeletal muscle gene expression, and quality of sleep during the dark time.
(A) Immunofluorescence of Sirt1 (green), Nkx2-1 (red), and merged image (right) in the DMH. White boxes show areas that are magnified at the lower right corners of each panel. (B and C) Wheel-running activity (B) and rectal body temperature (C) in DMH/LH-specific Sirt1, Nkx2-1, or Ox2r knockdown mice compared to control firefly luciferase (fLuc) knockdown mice. Results at each time point are shown as mean values ± S.E. (*p<0.05, **p<0.01, ***p<0.001 by Wilcoxon matched-pairs singled-ranks test (B) or Student’s t-test (C), n=6 mice for each group). (D) mRNA expression levels of skeletal muscle genes Pgc1 α, Idh3 α, Cytb, and Adrb2 in the soleus muscle from each knockdown mouse. Results are shown as mean values ± S.E. (*p<0.05 by one-way ANOVA with Tukey-Kramer post hoc test, n=4 mice for each group). (E) Levels of delta power in NREM sleep. Levels of delta power at each time point are shown as mean values ± S.E. (***p<0.001 by Wilcoxon matched-pairs singled-ranks test, n=3–4 mice for each group). (F–I) Wheel-running activity (F and H) and rectal body temperature (G and I) in DMH/LH-specific Sirt1 knockdown compared to fLuc knockdown in aged BRASTO (Tg) or wild-type control (WT) mice (F and G) or DMH-specific Sirt1 overexpression (OE) compared to control in aged B6 mice (H and I). Results at each time point are shown as mean values ± S.E. [Tg-fLuc vs. WT-fLuc, ##p<0.01; Tg-fLuc vs Tg-Sirt1 (F) or DMH-control vs DMH-Sirt1 OE (H), *p<0.05, ***p<0.001 by Wilcoxon matched-pairs singled-ranks test; *p<0.05 by one-way ANOVA with Tukey-Kramer post hoc test (G) and Student’s t-test (I), n=3–6 mice for each group]. Shaded area represents the dark time. See also Figure S5.

