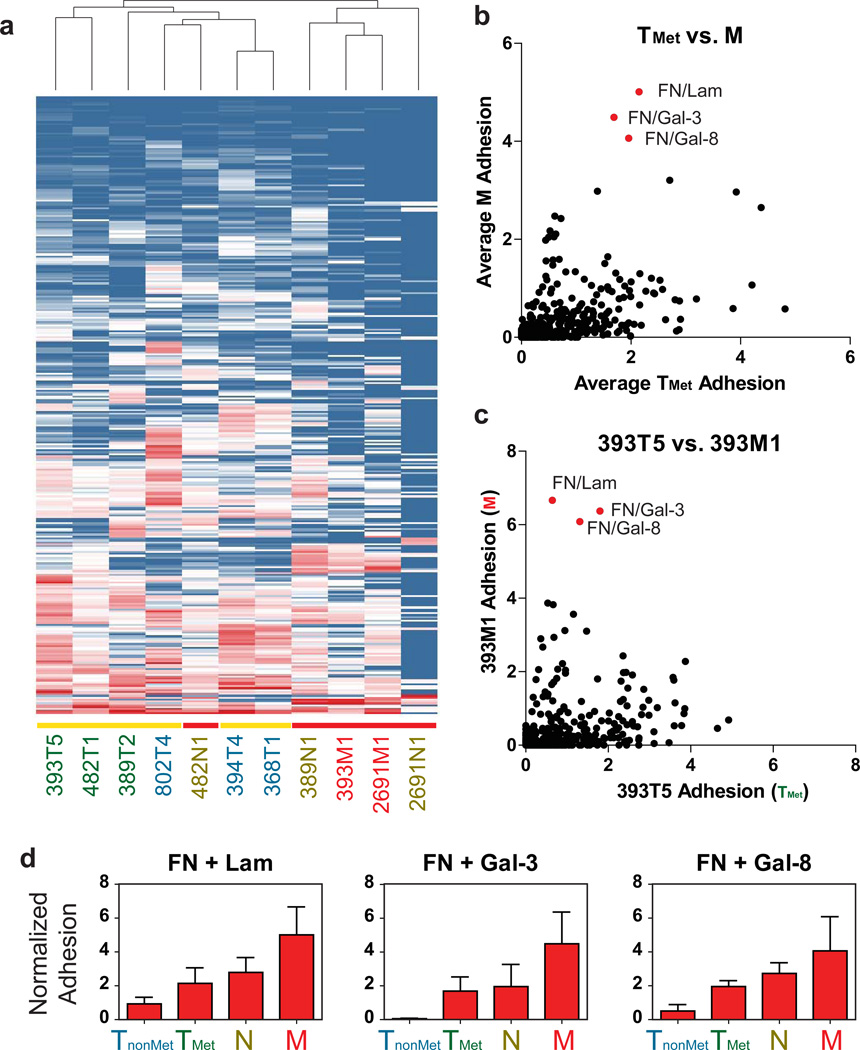
Figure 3. ECM Microarrays identify key adhesive changes in metastatic progression.
(a) Unsupervised hierarchical clustering of adhesion profiles generated by the ECM microarrays. Vertical axis represents different ECM combinations. Horizontal axis represents different cell lines. Yellow bars indicate primary tumors (TnonMet and TMet lines). Red bars indicate nodal (N) or distant metastases (M). (b) Average adhesion of metastatic cell lines (M) to each combination compared to those of the metastatic primary tumor cell lines (TMet). (c) Comparison of 393M1 adhesion for each combination to its matching primary tumor line, 393T5. Red dots indicate top ECM combinations exhibiting preferential adhesion by metastatic lines over the metastatic primary tumor lines. (d) Top three combinations exhibiting the greatest increase in adhesion across tumor progression as represented by the four classes of cell lines (TnonMet, TMet, N, and M). Error bars in (d) are s.e.m. of the different cell lines of each class (n = 3 cell lines per class) with the exception of the M class where there are two lines, and thus the error bars are the range of the means.

