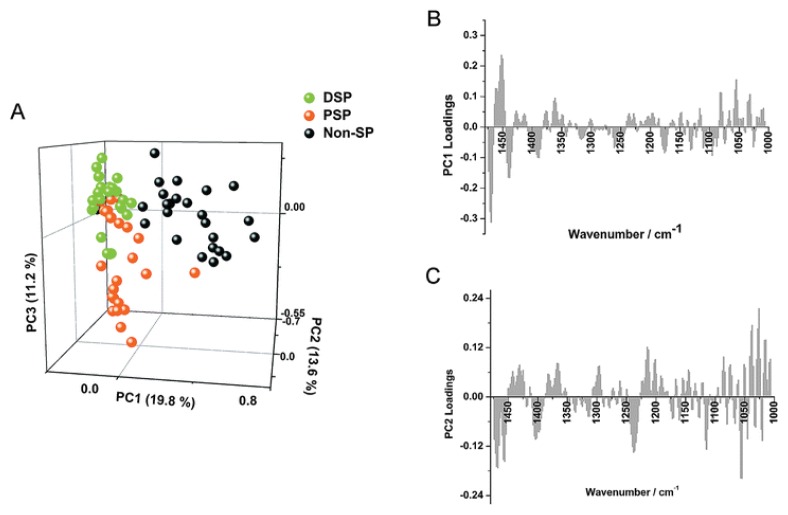
Figure 2.
PCA of subsets of “stem cell-like” renal epithelium carcinoma cells. Included in the analysis were the sub-side populations, distal side population (DSP) and proximal side population (PSP) vs. non-side population (Non-SP) cell spectra. (A) The scores plot of PC1, PC2 and PC3 and (B) corresponding loadings of PC1 and (C) PC2 are shown. Key biochemical differences are outlined in lipid, phosphodiester and carbohydrate absorption bands [26].

