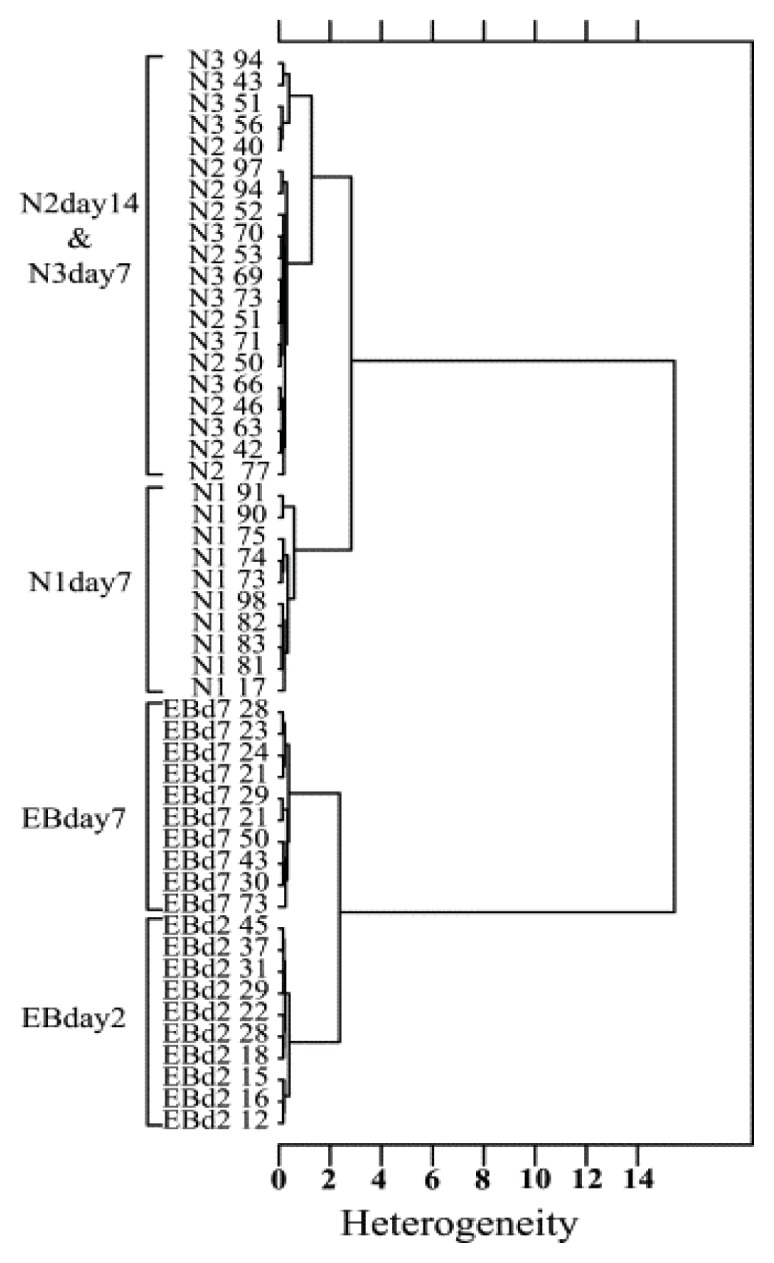
Figure 4.

UHCA results of mouse embryonic stem cells and progenitor cells at different stages of neural differentiation. Cluster analysis employed Ward’s algorithm using second derivatives, vector normalised spectra, over the spectral ranges 3000–2800 cm−1 to 1750–900 cm−1 [29].
